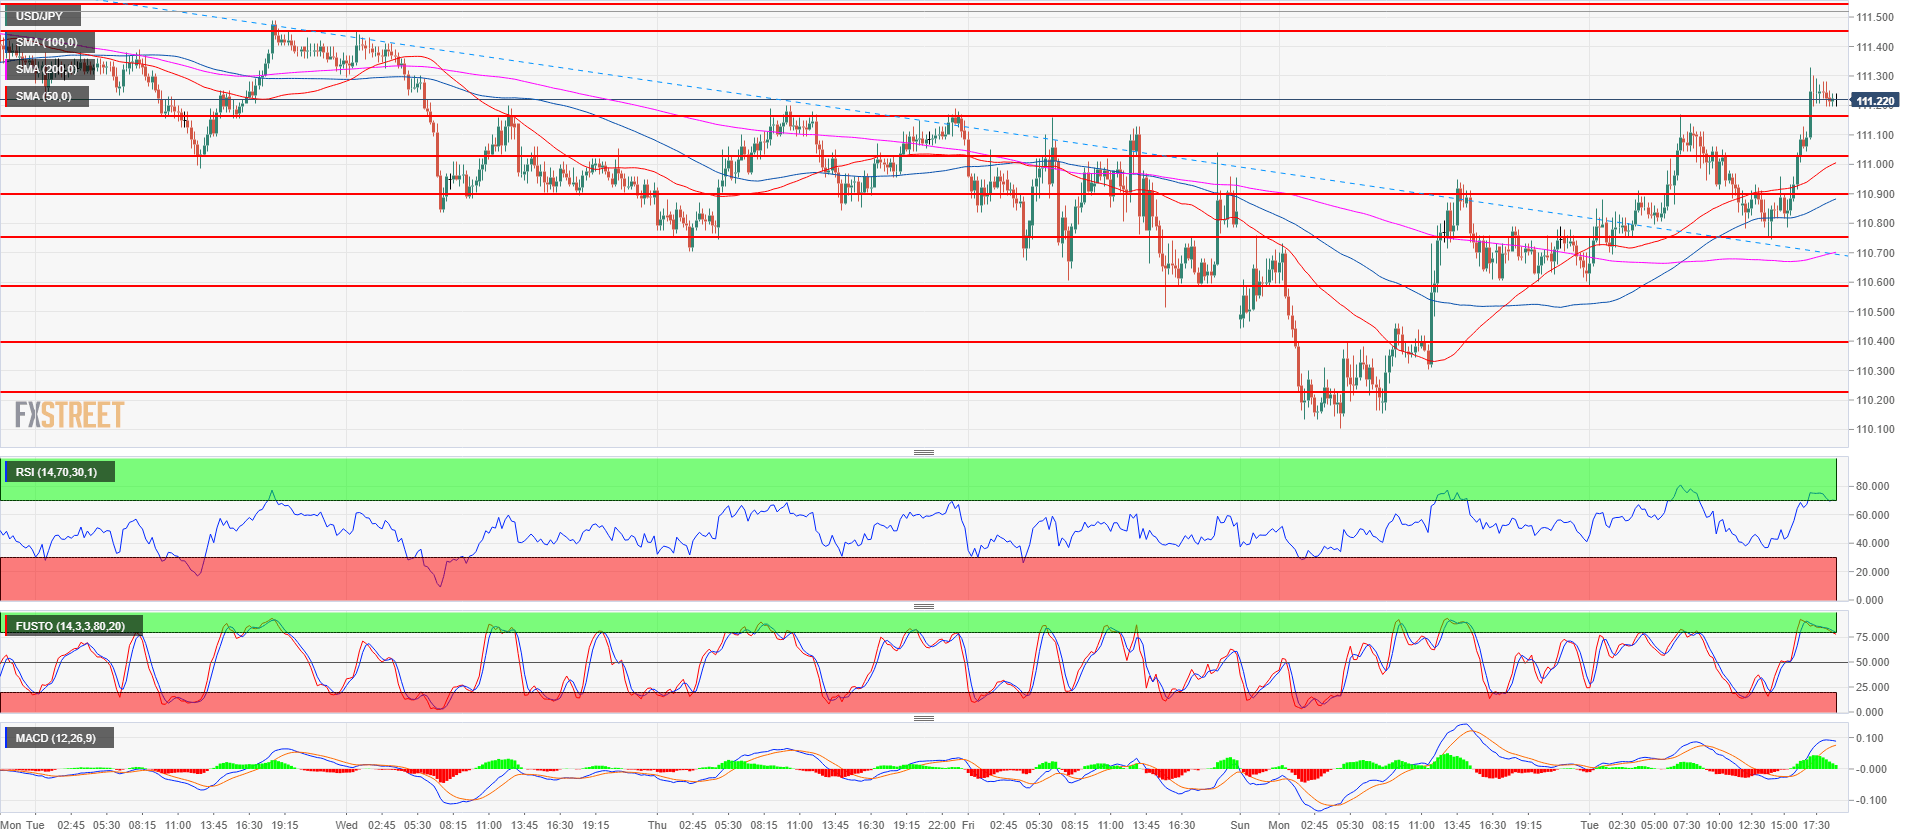
- Support at 110.75 held and bulls lifted the market about 55 pips from there. Bulls objective is to target 111.45 and 111.54-111.64 area in the coming sessions.
- Near-term supports are located near the 111.02-111.16 area, 110.90 and 110.75, July 23 low.
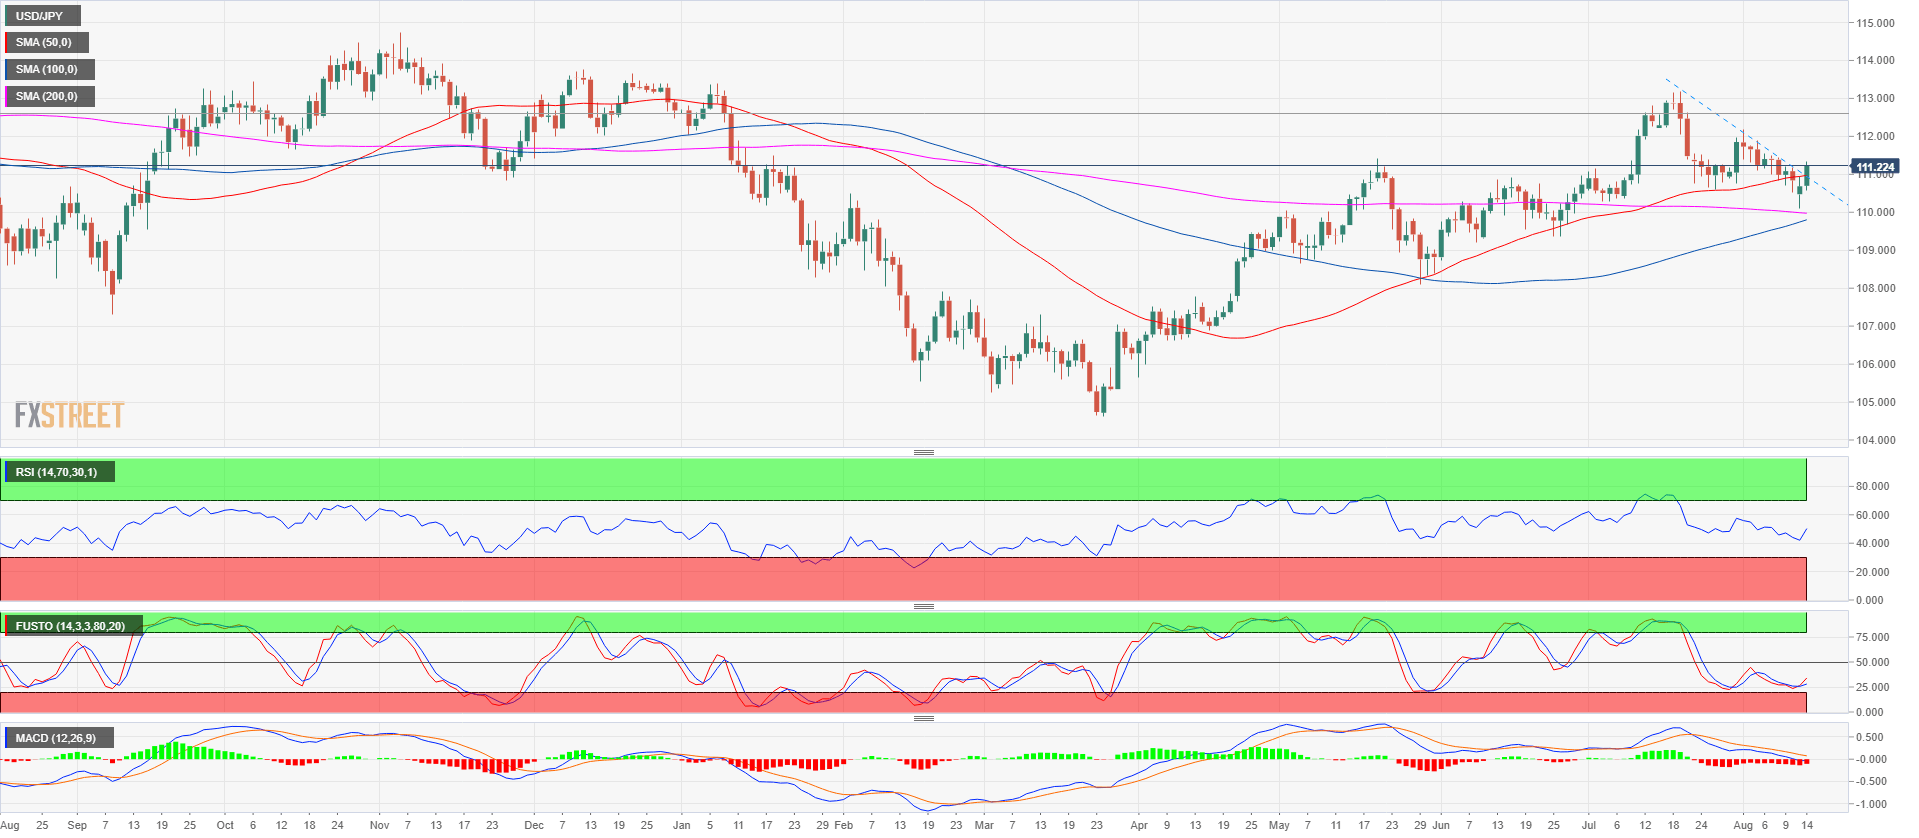
- USD/JPY is trading at its highest in the last three sessions after rebounding from the 200-daily simple moving average, suggesting a bullish bias.
USD/JPY 15-minute chart
USD/JPY daily chart
Spot rate: 111.21
Relative change: 0.47%
High: 111.33
Low: 110.58
Trend: Bullish
Resistance 1: 111.45 August 8 high
Resistance 2: 111.54-111.64 area, August 6, high and supply/demand level
Resistance 3: 111.82-112.00 area, supply level and figure
Resistance 4: 112.19-112.40 area, July 11 high and intraday swing low
Resistance 5: 112.64 July 12 high
Resistance 6: 113.18, 2018 high
Resistance 7: 113.26-113.38, 200-weekly simple moving average and January 8 high
Resistance 8: 114.45 October 27, 2017 high
Support 1: 111.02-111.16 area, figure and current August 6 low
Support 2: 110.90 June 15 swing high
Support 3: 110.75, July 23 low
Support 4: 110.58 July 26 swing low
Support 5: 110.40 demand level
Support 6: 110.27 July 4 low
