- USD/JPY bears made an incursion near the 110.10 level where the market found solid buying interest in Asia and early Europe. USD/JPY also found some strong support near the 200-daily simple moving average.
- USD/JPY has been in pullback mode since mid-July and today’s buying activity below 110.58 July 26 swing low suggest that USD/JPY bulls are not ready yet to let the main bull trend fizzle out that easily.
- If USD/JPY bulls are able to breakout above the 112.00 level, that would most likely be the confirmation that the bull trend has resumed its course.
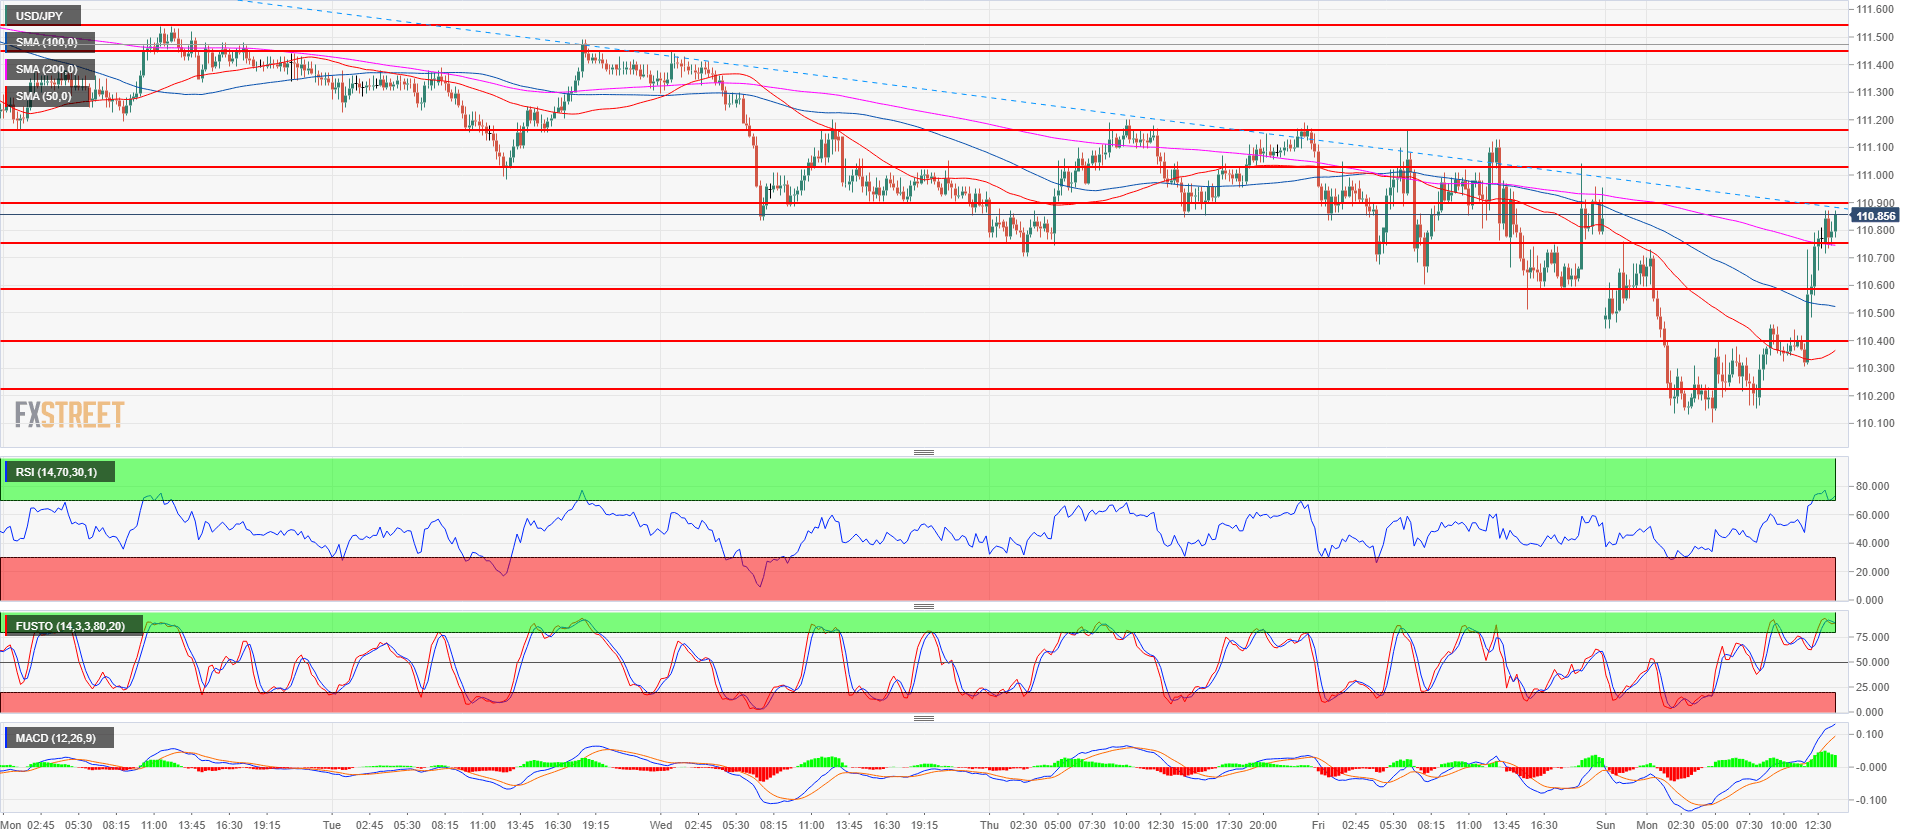
USD/JPY 15-minute chart
USD/JPY daily chart

Spot rate: 110.87
Relative change: 0.04%
High: 110.90
Low: 110.10
Trend: Bullish
Resistance 1: 110.90 June 15 swing high
Resistance 2: 111.02-111.16 area, figure and current August 6 low
Resistance 3: 111.45 August 8 high
Resistance 4: 111.54-111.64 area, August 6, high and supply/demand level
Resistance 5: 111.82-112.00 area, supply level and figure
Resistance 6: 112.19-112.40 area, July 11 high and intraday swing low
Resistance 7: 112.64 July 12 high
Resistance 8: 113.18, 2018 high
Resistance 9: 113.26-113.38, 200-weekly simple moving average and January 8 high
Resistance 10: 114.45 October 27, 2017 high
Support 1: 110.75, July 23 low
Support 2: 110.58 July 26 swing low
Support 3: 110.27 July 4 low
