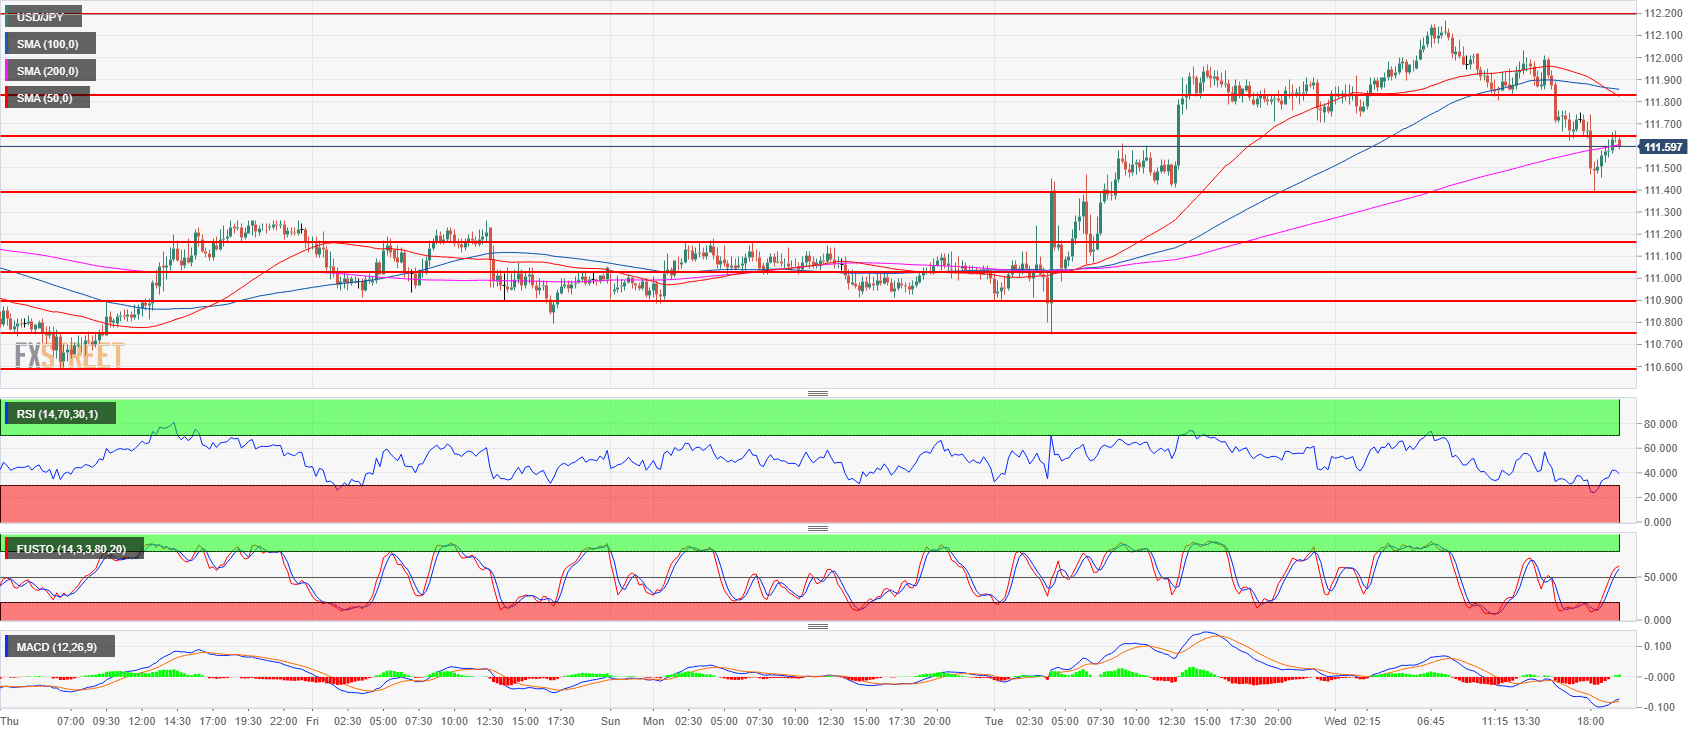
- The FOMC announced that it left the target interest rates unchanged in 1.75-2.00% range and USD/JPY fell to the 111.39 support from which it is now rebounding.
- USD/JPY is trying to regain the ground lost on Wednesday as it trying to keep prices above the 200-period simple moving average (SMA). The 50 SMA crossed below the 100 SMA suggesting that the market is now losing some bullish momentum in the near-term.
- Failure to recapture 111.82-112.00 would be seen as a bearish sign. Supports lie at 111.39 and 111.02-111.16 area.
Spot rate: 111.61
Relative change: -0.22%
High: 112.17
Low: 111.39
Trend: Bullish / Bearish reversal risk below 111.82-112.00
Resistance 1: 111.64 supply/demand level
Resistance 2: 111.82-112.00 area, supply level and figure
Resistance 3: 112.19-112.40 area, July 11 high and intraday swing low
Resistance 4: 112.64 July 12 high
Resistance 5: 113.18, 2018 high
Resistance 6: 113.26-113.38, 200-weekly simple moving average and January 8 high
Resistance 7: 114.45 October 27, 2017 high
Support 1: 111.39 May 21 swing high
Support 2: 111.02-111.16 area previous intraday swing lows
Support 3: 110.90 June 15 swing high
Support 4: 110.75, July 23 low
Support 5: 110.58 July 26 low
Support 6: 110.27 July 4 low
