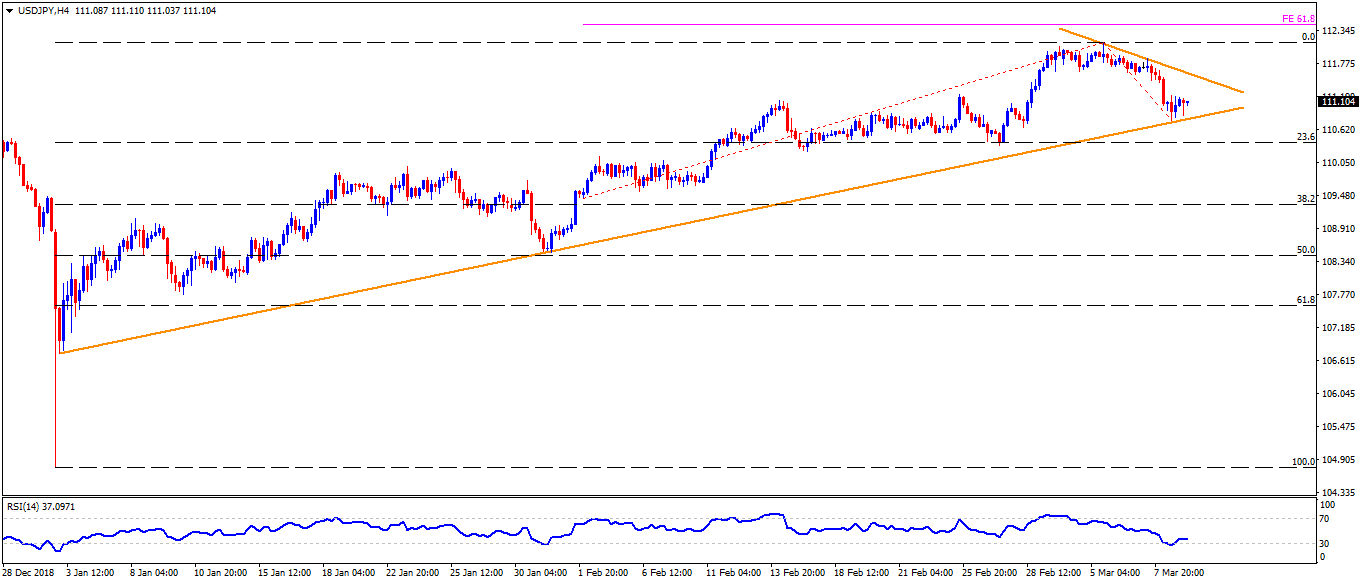
- USD/JPY is on bid around 111.00 during early Monday.
- The quote took a U-turn from nearly ten-week-old ascending support-line stretched since January 03 lows after flash crash.
- With this, buyers can aim for 111.60 on the break of 111.20 immediate resistance. However, a downward sloping trendline joining recent highs can challenge the pair’s upside then after.
- If at all prices rally beyond 111.60, 112.20 and 61.8% Fibonacci expansion (FE) of recent moves, at 112.50, can entertain bulls.
- Meanwhile, the downside break of 110.80 support-line highlights the importance of 23.6% Fibonacci retracement of January – March recovery, at 110.40.
- Additionally, pair’s extended declines under 110.40 might not refrain from recalling 110.00 and 109.60 on the chart.
USD/JPY 4-Hour chart
Additional important levels:
Overview:
Today Last Price: 111.1
Today Daily change: -3 pips
Today Daily change %: -0.03%
Today Daily Open: 111.13
Trends:
Daily SMA20: 111.02
Daily SMA50: 109.91
Daily SMA100: 111.35
Daily SMA200: 111.4
Levels:
Previous Daily High: 111.7
Previous Daily Low: 110.78
Previous Weekly High: 112.14
Previous Weekly Low: 110.78
Previous Monthly High: 111.5
Previous Monthly Low: 108.73
Daily Fibonacci 38.2%: 111.13
Daily Fibonacci 61.8%: 111.35
Daily Pivot Point S1: 110.7
Daily Pivot Point S2: 110.28
Daily Pivot Point S3: 109.78
Daily Pivot Point R1: 111.63
Daily Pivot Point R2: 112.13
Daily Pivot Point R3: 112.56
