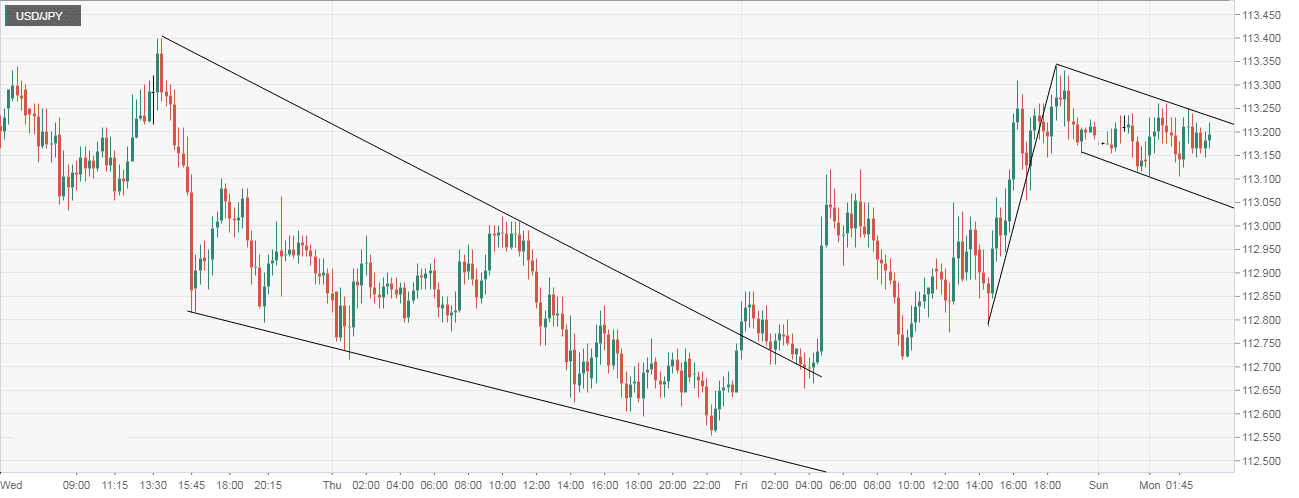
- The USD/JPY pair has created a bull flag pattern on the 15-min chart. It is a bullish continuation pattern, which means an upside breakout would imply a resumption of the rally from the low of 112.79 and open the doors to break above the recent high of 113.23.
- Notably, the bull flag breakout would bolster the already bullish setup indicated by the falling wedge breakout (witnessed on Friday) and ascending 50-, 100-, 200-hour exponential moving averages (EMAs).
- All-in-all, the bull flag breakout is more likely to happen. The bullish view would be invalidated below 113.00.
15-min Chart
Trend: Bullish
USD/JPY
Overview:
Last Price: 113.18
Daily change: -1.0 pips
Daily change: -0.00883%
Daily Open: 113.19
Trends:
Daily SMA20: 112.52
Daily SMA50: 112.34
Daily SMA100: 111.7
Daily SMA200: 109.93
Levels:
Daily High: 113.34
Daily Low: 112.56
Weekly High: 113.4
Weekly Low: 111.78
Monthly High: 114.56
Monthly Low: 111.38
Daily Fibonacci 38.2%: 113.04
Daily Fibonacci 61.8%: 112.85
Daily Pivot Point S1: 112.72
Daily Pivot Point S2: 112.24
Daily Pivot Point S3: 111.93
Daily Pivot Point R1: 113.5
Daily Pivot Point R2: 113.81
Daily Pivot Point R3: 114.29
