- USD/JPY confronts 23.6% Fibonacci retracement of early-month upside.
- A three-day-old falling trend line adds to the resistance.
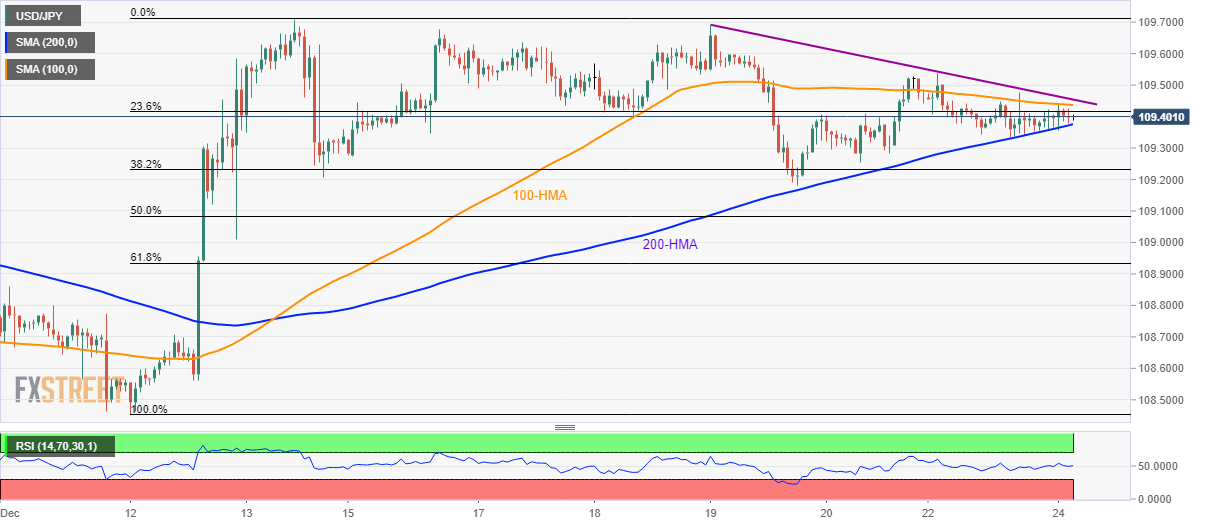
USD/JPY trades around 109.40 ahead of Tuesday’s European session. The pair has been choppy between the 100 and 200-Hour Simple Moving Averages (HMAs) off-late.
In addition to the 109.37/45 range described by 100 and 200-HMA respectively, a downward sloping trend line since December 19, at 109.47 now, also acts as near-term key technical levels.
While a price break above 109.47 can challenge the monthly high near 109.70, a downside break below 109.37 opens the door for the pair’s drop to 109.00.
It should, however, be noted that any further movements beyond either 109.70 or below 109.00 will confront 110.00 and 108.80.
It’s also worth mentioning that the year-end holiday season and normal conditions of the 14-bar Relative Strength Index (RSI) dim the prospects of the pair’s major moves.
USD/JPY hourly chart
Trend: Sideways
