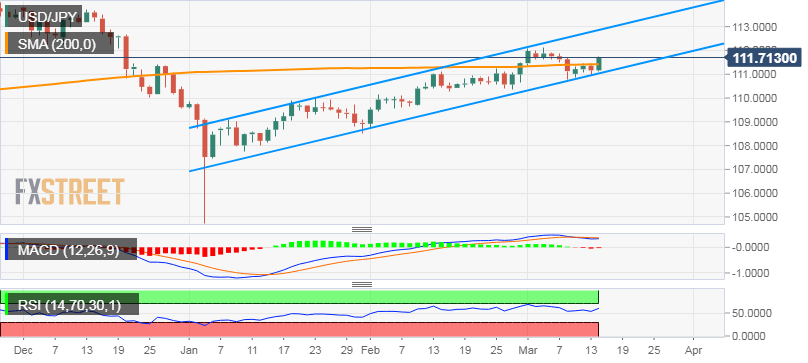
“¢ Having defended a short-term ascending trend-channel support in the previous session, the pair regained positive traction on Thursday and jumped to one-week tops in the last hour.
“¢ A sustained move back above the very important 200-day SMA hurdle near mid-111.00s was seen as a key trigger for intraday bullish traders amid a slight improvement in risk sentiment.
“¢ Bullish oscillators on 4-hourly/daily charts support prospects for an extension of the positive momentum, through slightly overbought conditions on the 1-hourly chart warrant caution.
“¢ Hence, any subsequent up-move is likely to confront heavy supply near the 111.90-112.00 region, above which the pair could aim to reclaim the 113.00 handle and challenge the channel resistance.
USD/JPY daily chart
USD/JPY
Overview:
Today Last Price: 111.7
Today Daily change: 54 pips
Today Daily change %: 0.49%
Today Daily Open: 111.16
Trends:
Daily SMA20: 111.11
Daily SMA50: 110.02
Daily SMA100: 111.31
Daily SMA200: 111.42
Levels:
Previous Daily High: 111.47
Previous Daily Low: 111
Previous Weekly High: 112.14
Previous Weekly Low: 110.78
Previous Monthly High: 111.5
Previous Monthly Low: 108.73
Daily Fibonacci 38.2%: 111.18
Daily Fibonacci 61.8%: 111.29
Daily Pivot Point S1: 110.95
Daily Pivot Point S2: 110.75
Daily Pivot Point S3: 110.49
Daily Pivot Point R1: 111.42
Daily Pivot Point R2: 111.68
Daily Pivot Point R3: 111.88
