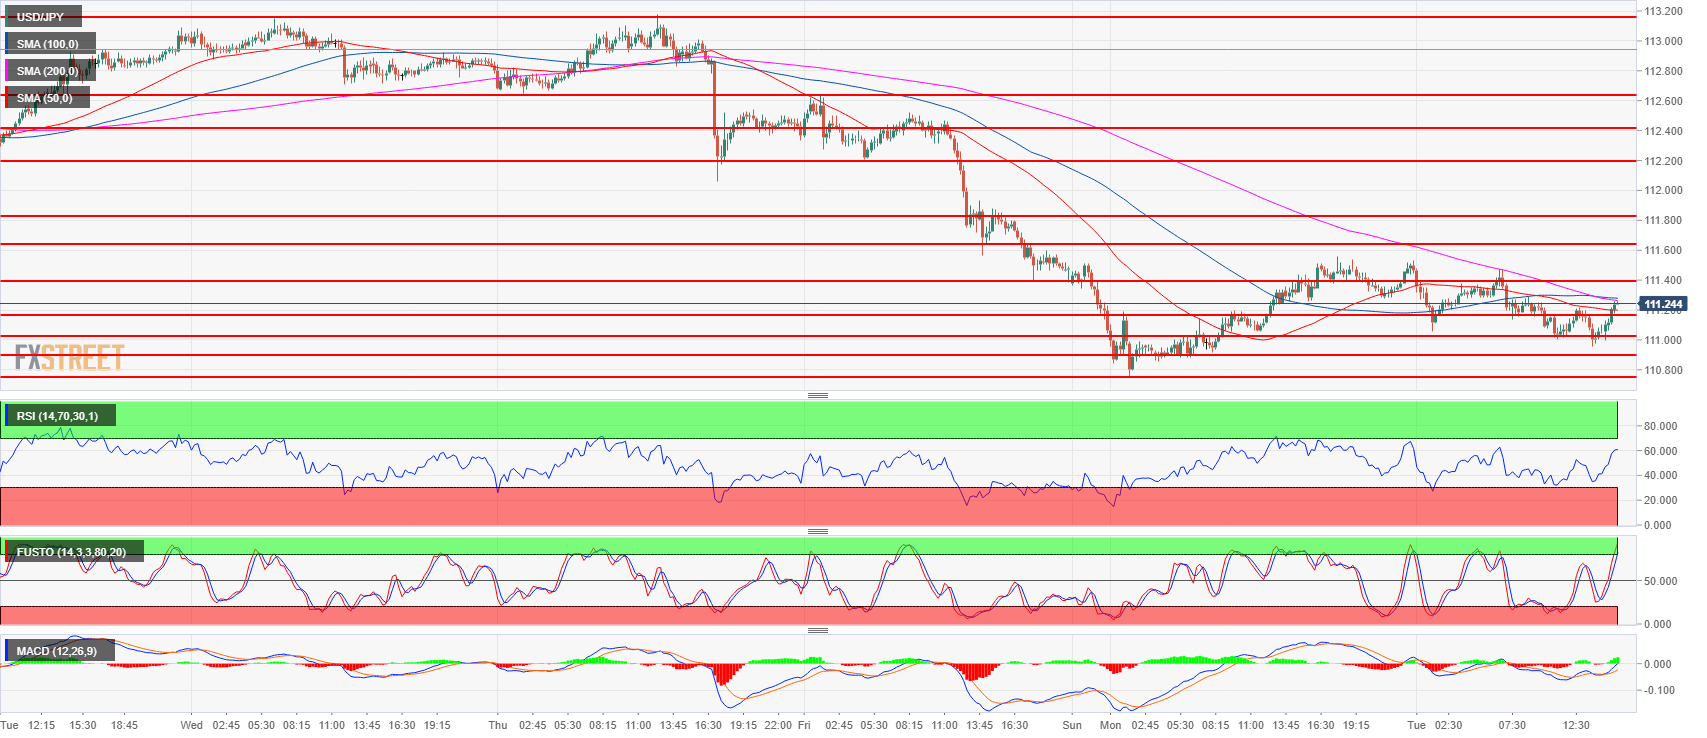
- USD/JPY is trading inside yesterday’s range still holding on above the 111.00 level and the daily trendline from March, 26.
- USD/JPY bulls are trying to put an end to the bearish pullback of the last three days but they need to overcome the 200-period simple moving average and the 111.60-111.80 area.
- On the flip side bears, want a breakout below 111.02-111.16 area and 110.75, July 23 low.
USD/JPY 15-minute chart
Spot rate: 111.27
Relative change: -0.06%
High: 111.53
Low: 110.95
Trend: Bullish / Bearish correction
Resistance 1: 111.39 May 21 swing high
Resistance 2: 111.60-111.80 area, 23.6% and 38.2% Fibonacci retracement low/high July 11
Resistance 3: 112.19-112.40 area, July 11 high and intraday swing low
Resistance 4: 112.64 July 12 high
Resistance 5: 113.18, 2018 high
Resistance 6: 113.26-113.38, 200-weekly simple moving average and January 8 high
Resistance 7: 114.45 October 27, 2017 high
Support 1: 111.02-111.16 previous intraday swing lows
Support 2: 110.75-110.90, July 23 low and June 15 swing high
Support 3: 110.27 July 4 low
