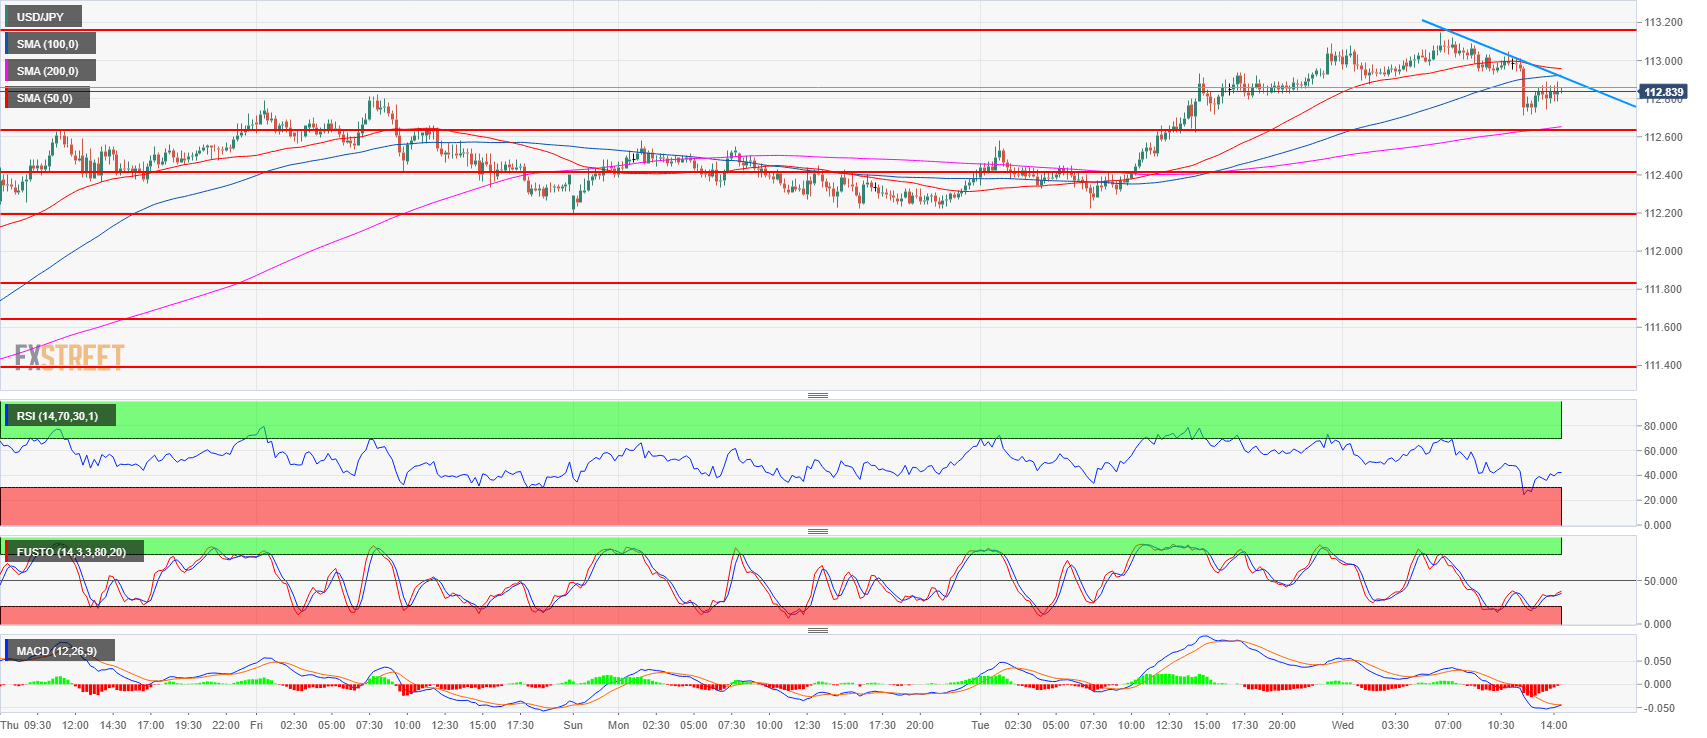
- USD/JPY printed a new 2018 high at 113.15 and is now having a pullback above the 200-period simple moving average.
- USD/JPY consolidation might continue towards 112.64 and 112.40 support in the near-term.
- A strong bear breakout below 112.20, near Tuesday’s low would be seen as a slow down of the current bull momentum and a deeper correction might be underway.
Spot rate: 112.85
Relative change: -0.03%
High: 113.15
Low: 112.71
Trend: Bullish
Resistance 1: 113.15, 2018 high
Resistance 2: 113.26-113.38, 200-weekly simple moving average and January 8 high
Resistance 3: 114.45 October 27, 2017 high
Support 1: 112.64 July 12 high
Support 2: 112.19-112.40 area, July 11 high and intraday swing low
Support 3: 111.60-111.80 area, 23.6% and 23.2% Fibonacci retracement low/high July 11
Support 4: 111.39 May 21 swing high
Support 5: 111.02-111.16 previous intraday swing lows
Support 6: 110.90 June 15 swing high
