- USD/JPY is currently in a consolidation phase after the bull run seen last week.
- USD/JPY is currently supported at 112.19 (July 11 high) and the near-term resistance is 112.64 (July 12 high).
- The bears want to convert the bull trend in a bearish reversal by breaking 112.19 while bulls want to drive the market near the current 2018 high at 112.82.
- Both parties are fairly balanced but since the bearish correction has been very weak so far, the bulls are still owning the market at this point in time.
USD/JPY 15-minute chart
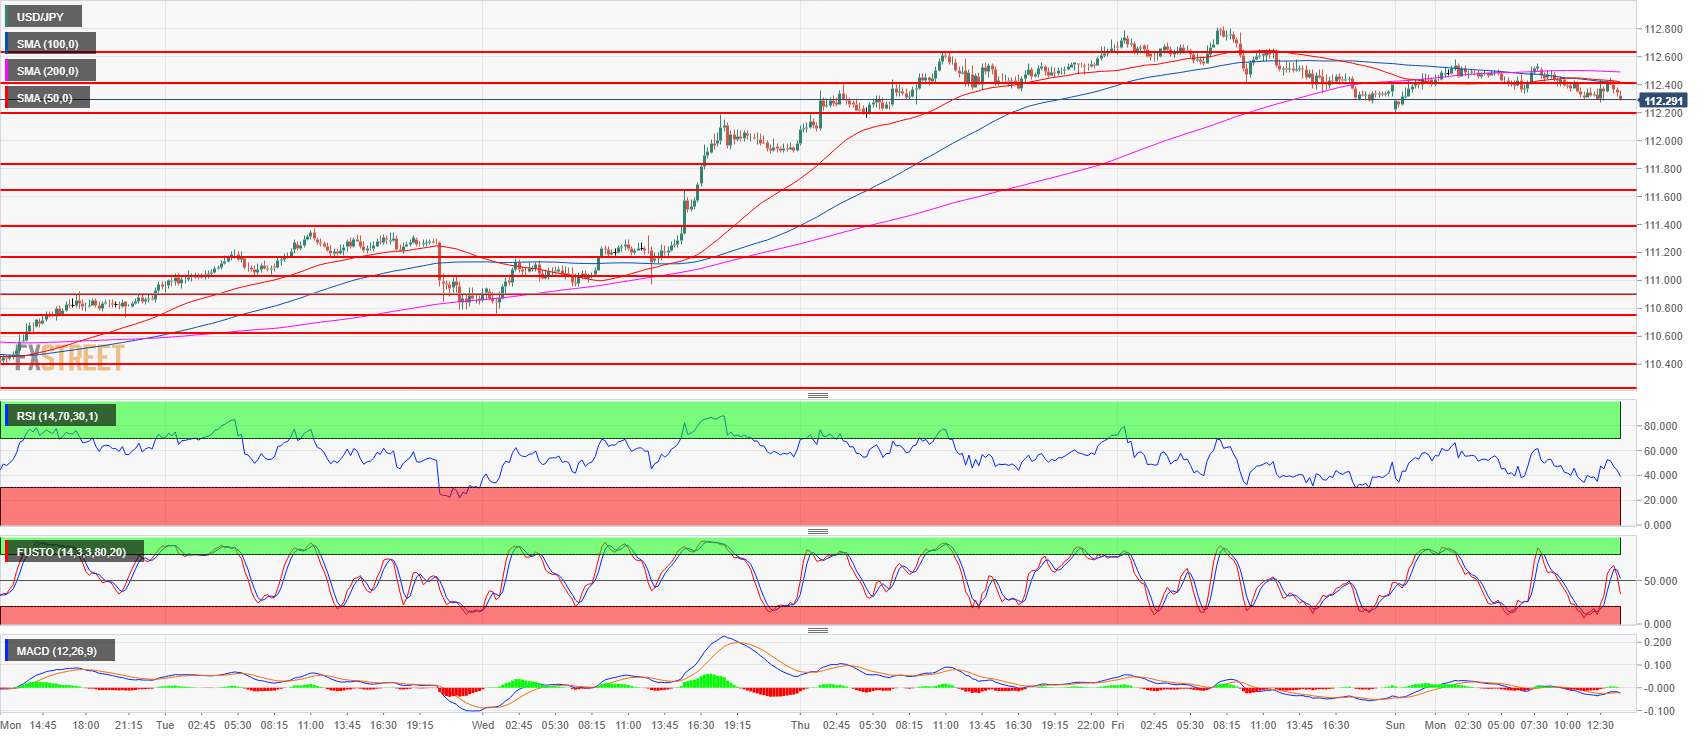
Spot rate: 112.30
Relative change: -0.09%
High: 112.58
Low: 112.19
Trend: Neutral
Resistance 1: 112.40 intraday swing low
Resistance 2: 112.64 July 12 high
Resistance 3: 112.82, 2018 high
Resistance 4: 113.38 January 8 high
Resistance 5: 114.45 October 27, 2017 high
Support 1: 112.19, July 11 high
Support 2: 111.60-111.80 area, 23.6% and 23.2% Fibonacci retracement low/high July 11
Support 3: 111.39 May 21 swing high
Support 4: 111.02-111.16 previous intraday swing lows
Support 5: 110.90 June 15 swing high
