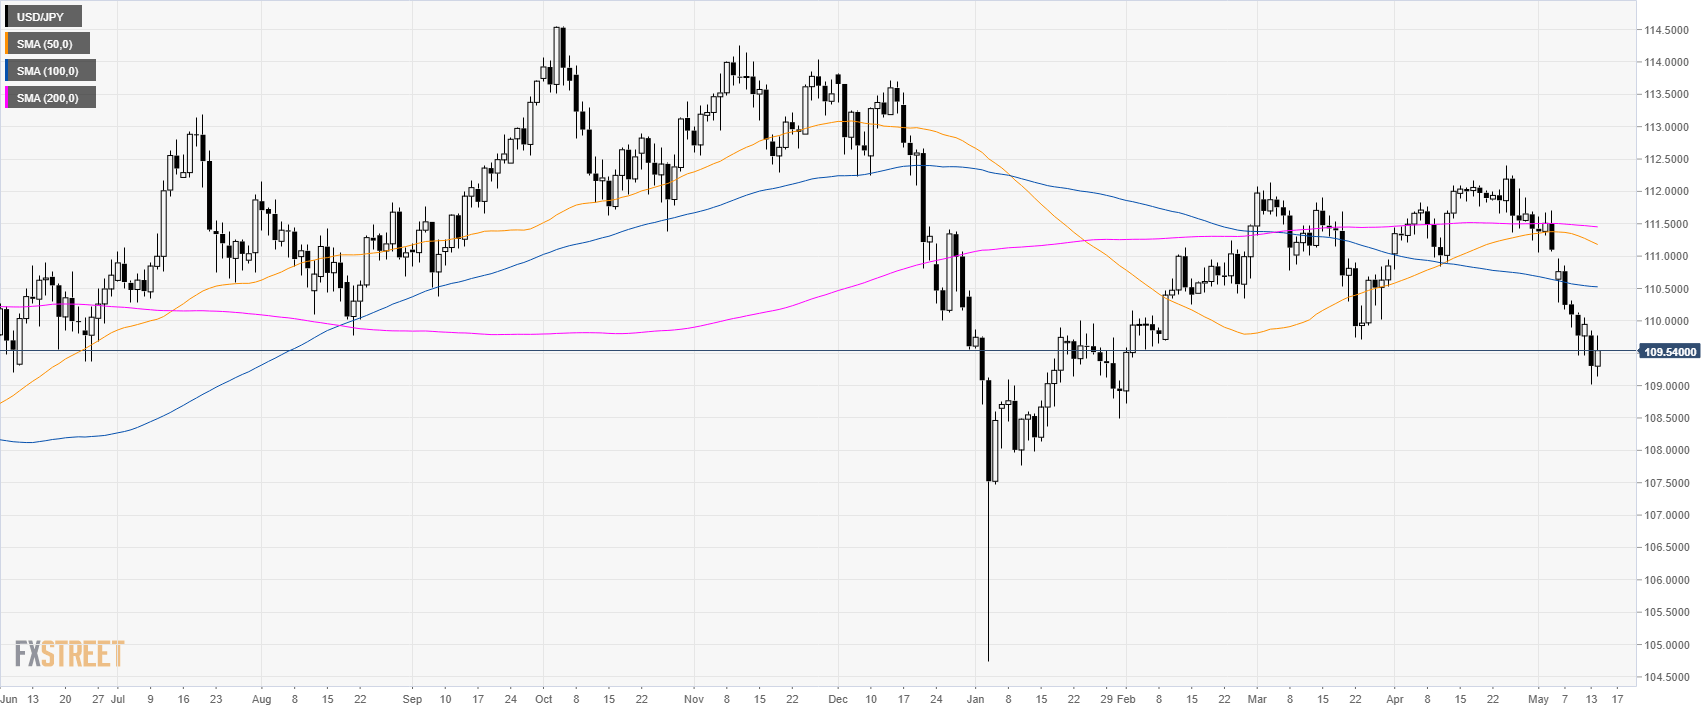
USD/JPY daily chart
USD/JPY is trading in a bear leg below its main simple moving averages (SMAs).
USD/JPY is trading at its lowest since early February.
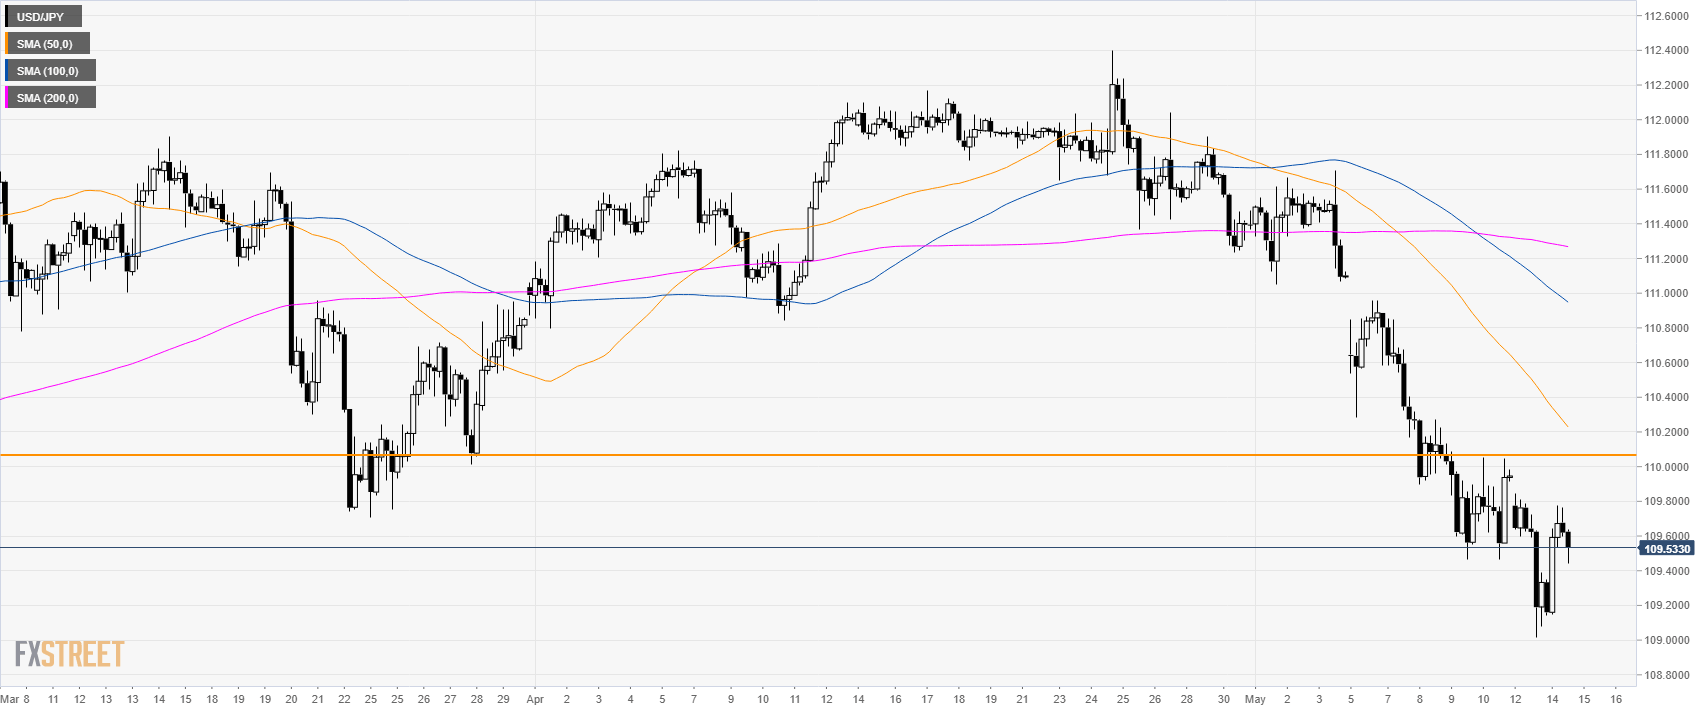
USD/JPY 4-hour chart
USD/JPY reversed up sharply after testing the 109.00 figure. However bulls would need to trade above 110.06 in order to start making a higher high and potentially confirming a bottom.
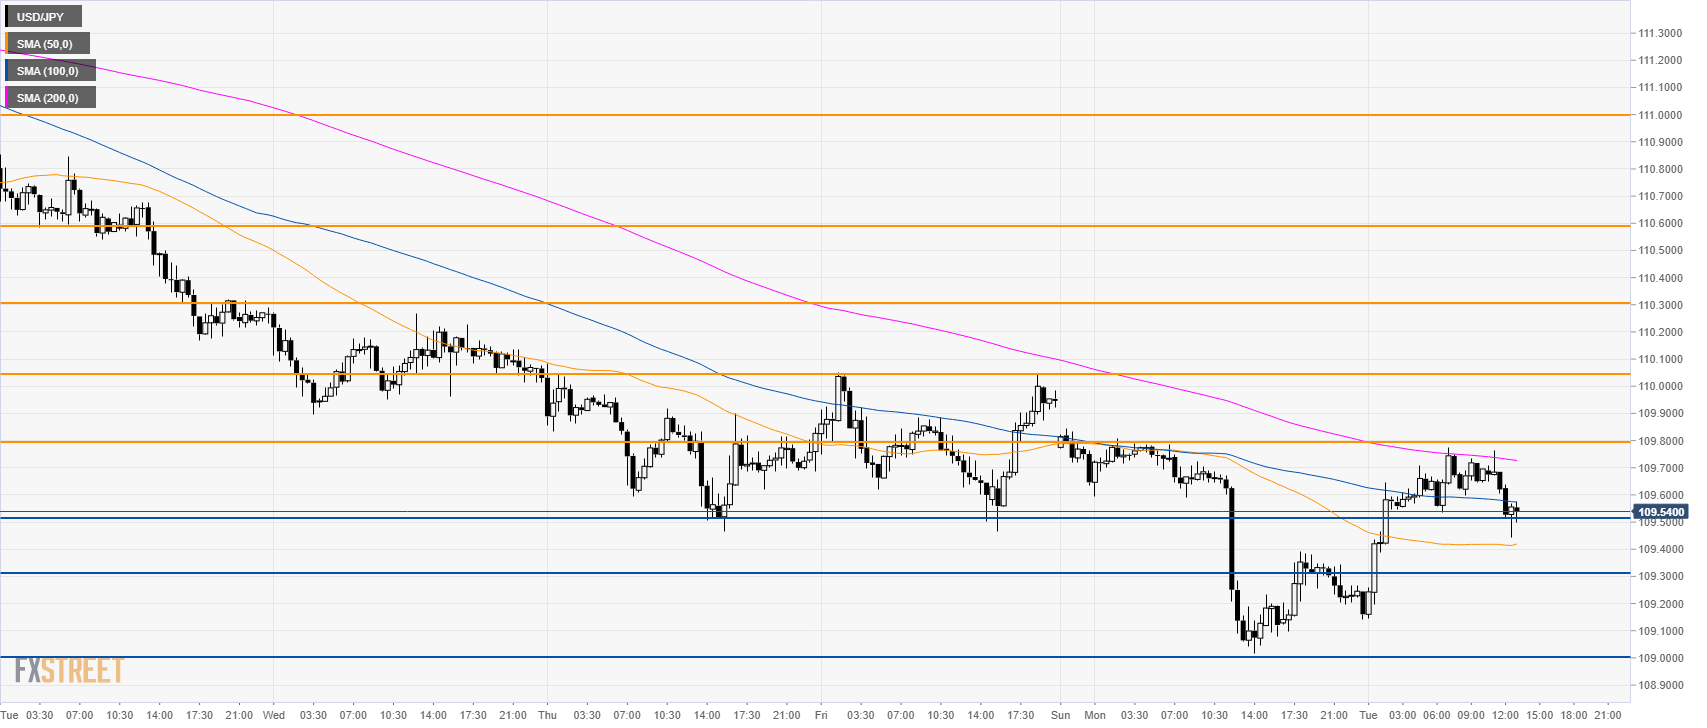
USD/JPY 30-minute chart
USD/JPY is stabilizing above the 109.00 figure as the market challenged the 109.80 resistance and the 200 SMA. Bulls seem to be back and they will have to overcome 109.80 and the 110.06 resistance to travel towards 110.30 and 110.60 level.
Support is at 109.50/30 and the 109.00 round number.
Additional key levels
