- USD/JPY rises to 23.6% Fibonacci retracement after posting a Doji on Friday.
- 200-day SMA keeps the quote’s upside capped for the last two weeks.
- 50-day SMA, 38.2% Fibonacci retracement limit near-term declines.
Although it is trading near a four day high, around 108.75 by the press time of early Monday, the USD/JPY pair confronts short-term resistance following a trend reversal candlestick formation flashed the previous day.
With the Friday’s Doji candlestick formation on the daily (D1) chart increasing odds for the pair’s pullback, sellers look for entry below 50-day Simple Moving Average (SMA) and 38.2% Fibonacci retracement of October-November upside, around 108.35/30.
In doing so, the monthly bottom surrounding 107.90 and 61.8% Fibonacci retracement level close to 107.62 will be on bears’ radar.
Alternatively, pair’s upside beyond 23.6% Fibonacci retracement of 108.80 will need to cross a 200-day SMA level of 109.00, which in turn could propel prices towards the monthly top around 109.50.
USD/JPY daily chart
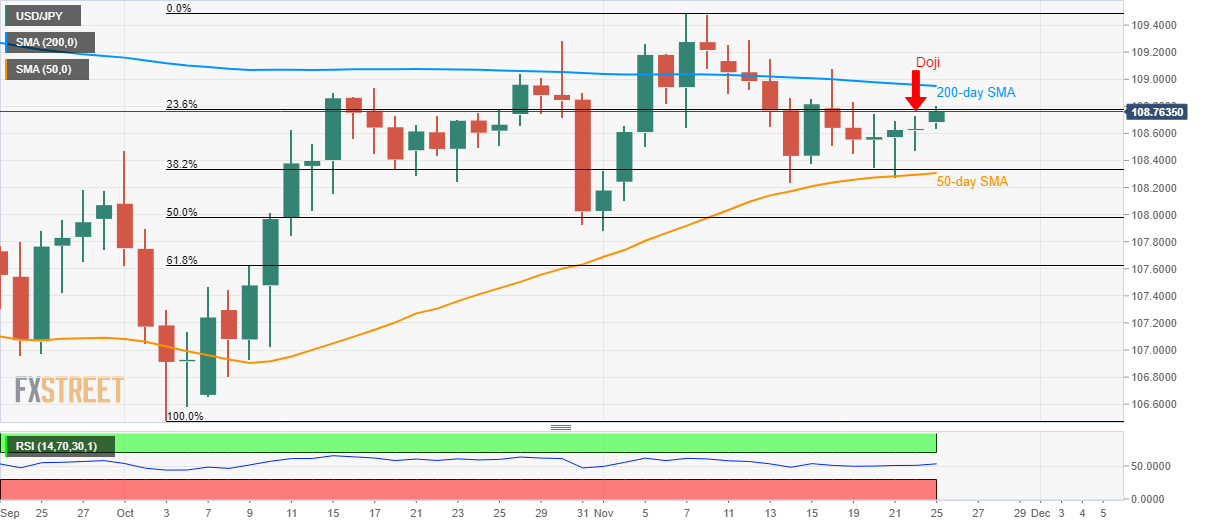
Trend: Pullback expected
