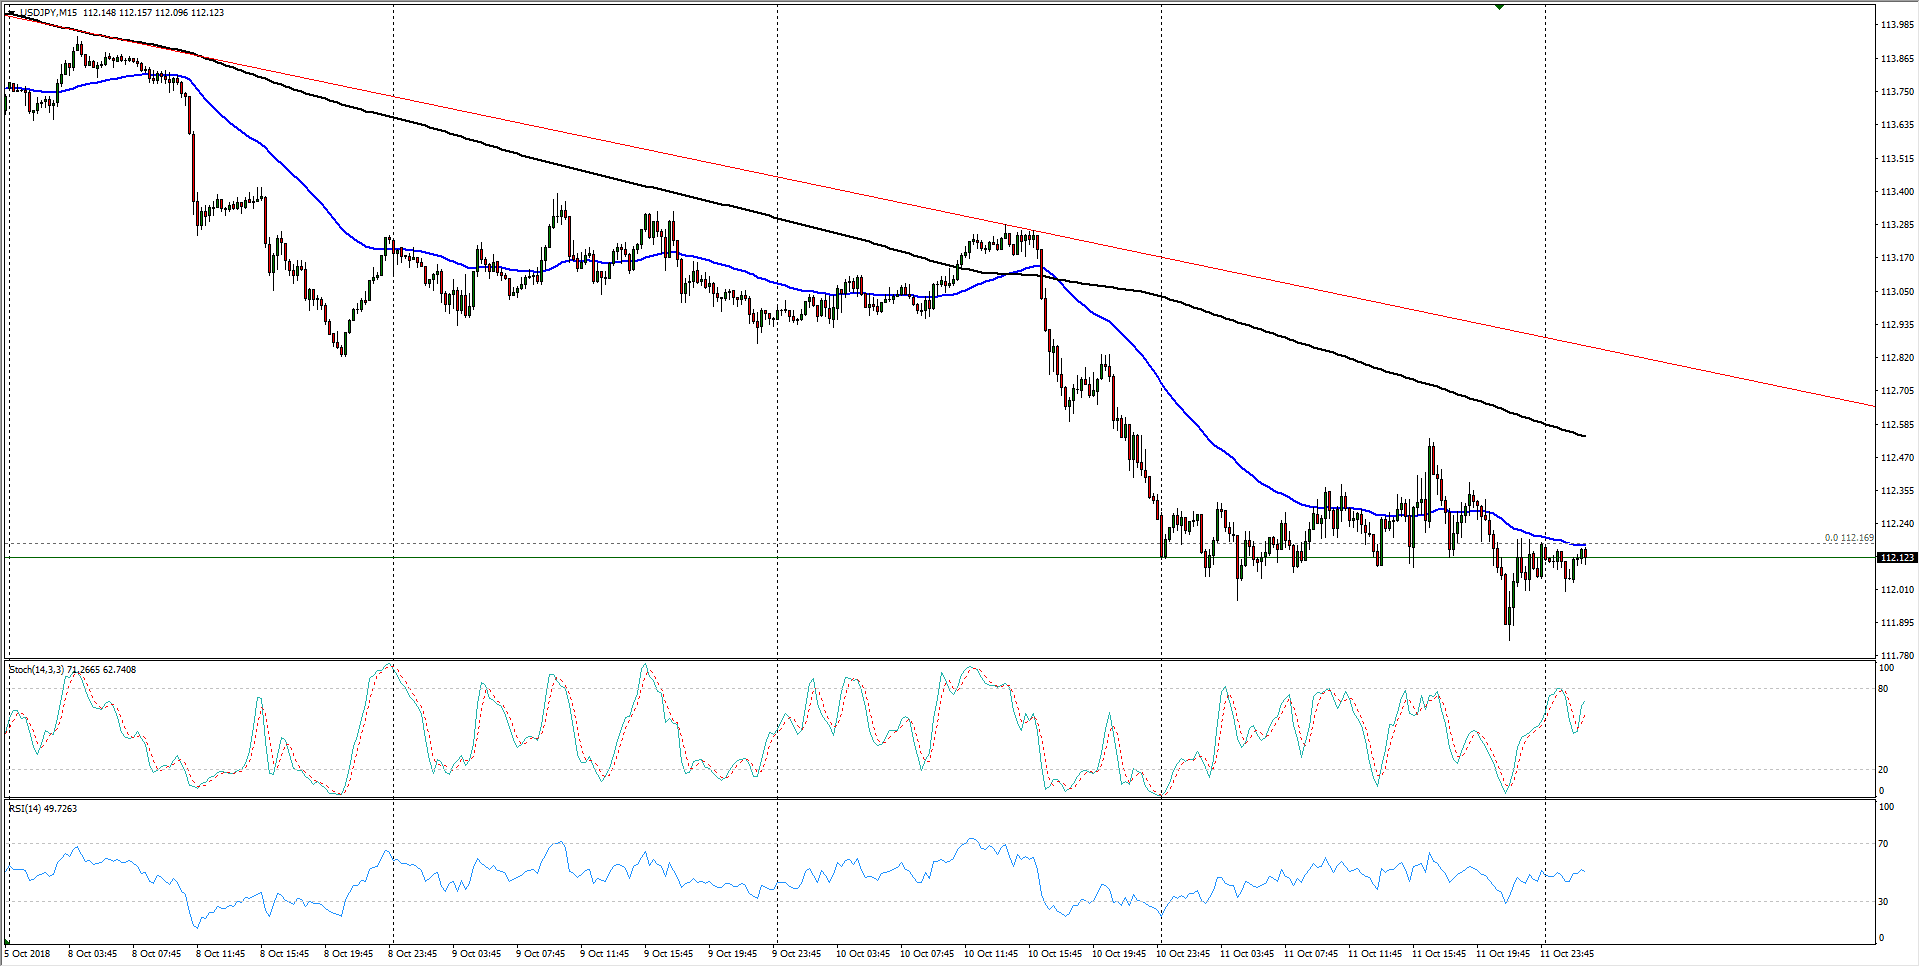
- The Dollar has seen steady declines against the Japanese Yen this week, and the pair appears to be gathering up for another push lower.
- The 112.00 handle remains a key trigger for the Dollar-Yen pairing after yesterday’s consolidation, and hourly indicators are middling as the pair remains constrained by the 200-period EMA at 112.55.
- A firm bearish trendline from last week’s peak at 114.55 remains intact and is helping steer the Greenback.
USD/JPY
Overview:
Last Price: 112.15
Daily change: -12 pips
Daily change: -0.107%
Daily Open: 112.27
Trends:
Daily SMA20: 112.97
Daily SMA50: 111.82
Daily SMA100: 111.23
Daily SMA200: 109.84
Levels:
Daily High: 113.3
Daily Low: 112.26
Weekly High: 114.56
Weekly Low: 113.52
Monthly High: 114.56
Monthly Low: 110.85
Daily Fibonacci 38.2%: 112.65
Daily Fibonacci 61.8%: 112.9
Daily Pivot Point S1: 111.92
Daily Pivot Point S2: 111.56
Daily Pivot Point S3: 110.87
Daily Pivot Point R1: 112.96
Daily Pivot Point R2: 113.65
Daily Pivot Point R3: 114.01
