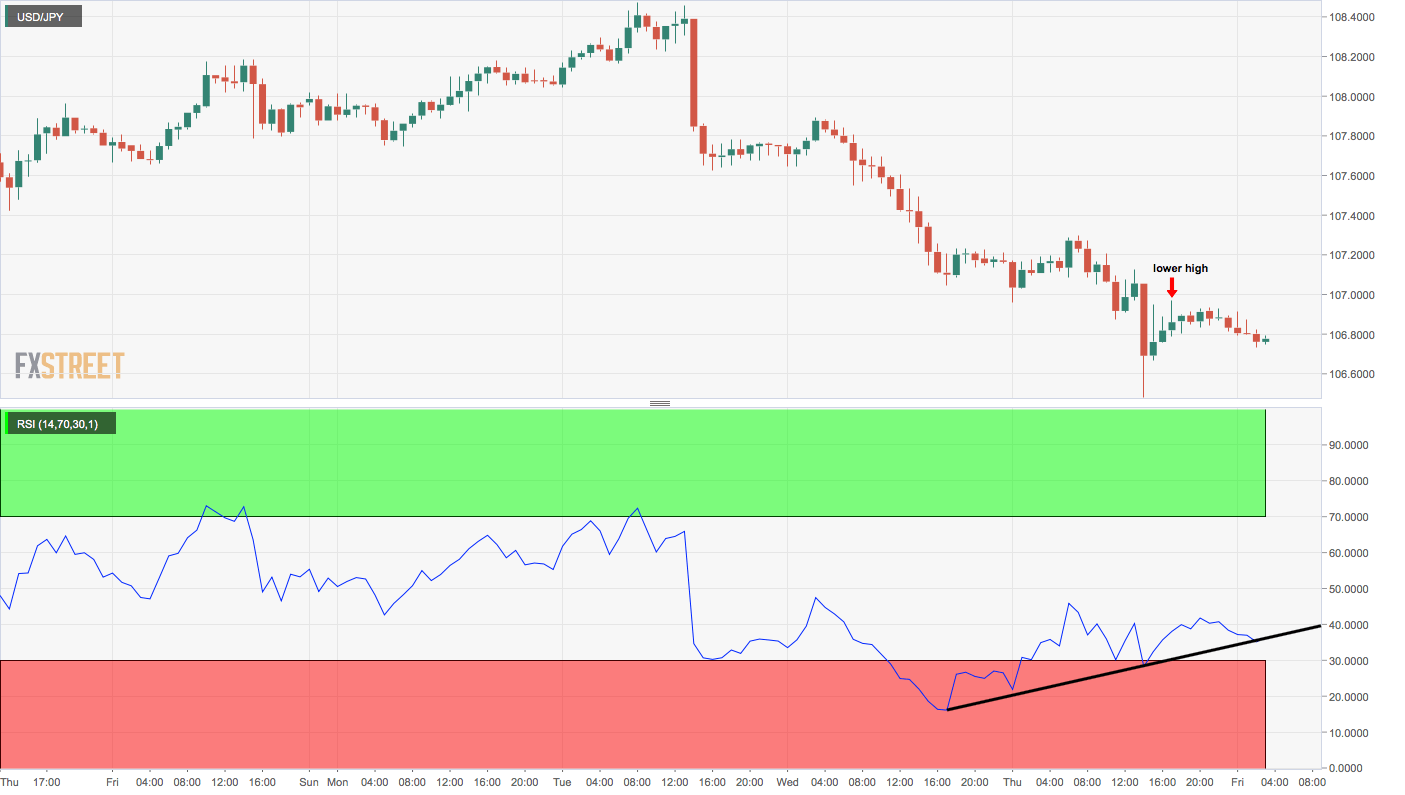
- USD/JPY is looking south, having charted a bearish lower high above 106.90 in Asia.
- Key hourly and daily chart indicators are also reporting bearish conditions.
USD/JPY is currently trading at 106.77, representing 0.13% losses on the day, having clocked a high and low of 106.93 and 106.74, respectively, during the Asian trading hours.
With the drop from 106.93 to 106.74, the pair has formed another lower high on the hourly chart – the third since topping out near 108.50 earlier this week.
The hourly chart relative strength index (RSI) is looking to dive out of a rising trendline. Meanwhile, the 14-day RSI has dropped into the bearish territory below 50.
Hence, the pair risks falling back to Thursday’s low of 106.48 in the European session. A deeper drop could be seen if the US Nonfarm Payrolls data for September, due at 12:30 GMT, prints below estimates, sending the greenback lower across the board.
The bearish hourly chart setup would be invalidated if the pair rises above 106.96.
Daily chart

Hourly chart
Trend: Bearish
Technical levels
