- USD/JPY is falling to new daily lows reaching the 111.16 support level. Bulls will try to support the market but the attempt should be short-lived.
- USD/JPY bears are in control and the market should continue the descent towards 111.00 and beyond as USD/JPY broke below 111.39 support.
- Resistances to the upside are seen near 111.39 and 111.64 supply level.
USD/JPY 15-minute chart
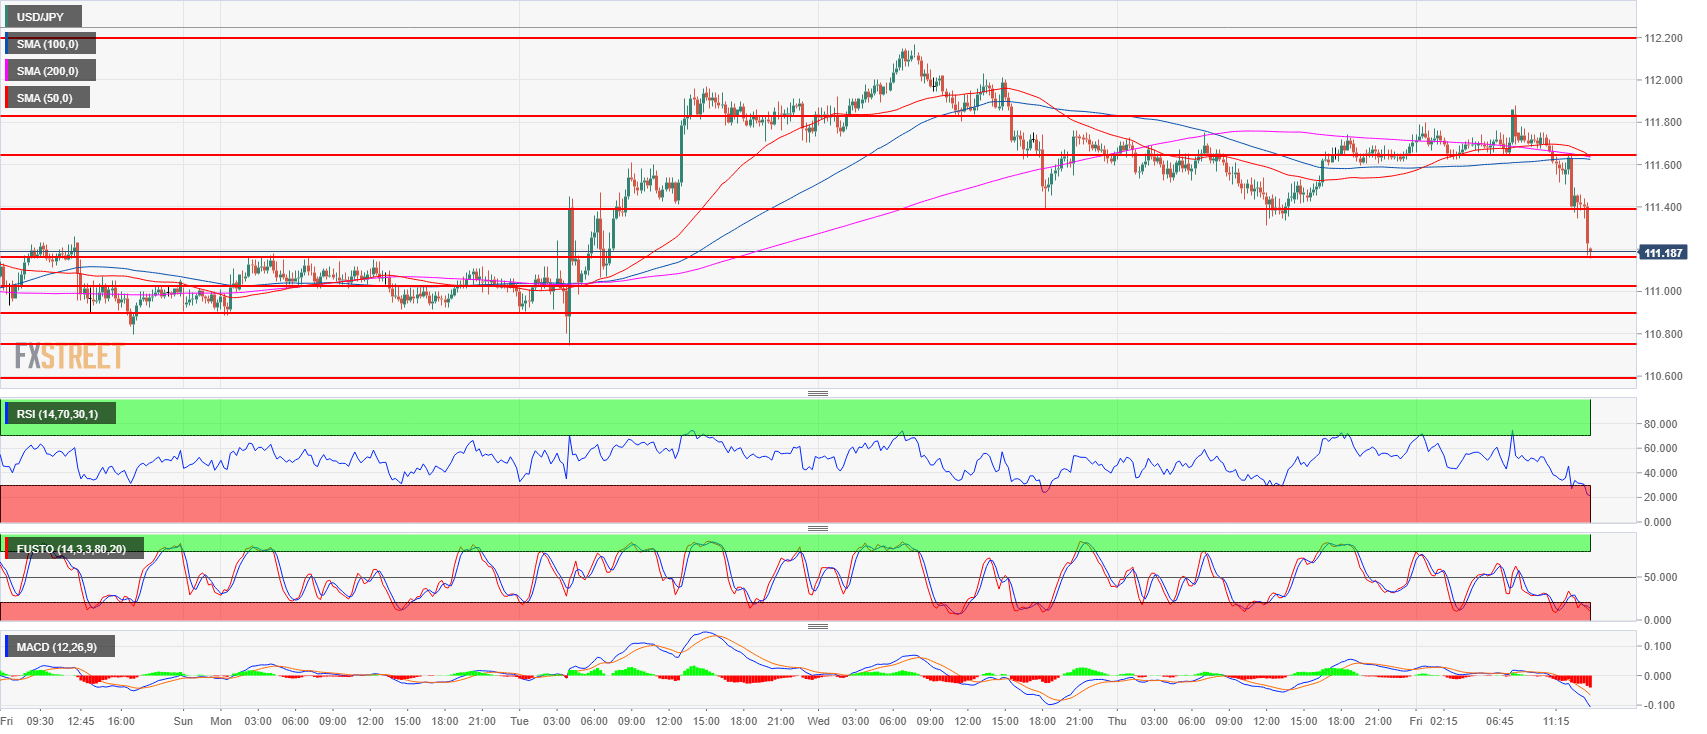
Spot rate: 111.19
Relative change: -0.41%
High: 111.87
Low: 111.14
Trend: Bearish
Resistance 1: 111.39 May 21 swing high
Resistance 2: 111.64 supply/demand level
Resistance 3: 111.82-112.00 area, supply level and figure
Resistance 4: 112.19-112.40 area, July 11 high and intraday swing low
Resistance 5: 112.64 July 12 high
Resistance 6: 113.18, 2018 high
Resistance 7: 113.26-113.38, 200-weekly simple moving average and January 8 high
Resistance 8: 114.45 October 27, 2017 high
Support 1: 111.02-111.16 area previous intraday swing lows
Support 2: 110.90 June 15 swing high
Support 3: 110.75, July 23 low
Support 4: 110.58 July 26 low
Support 5: 110.27 July 4 low
