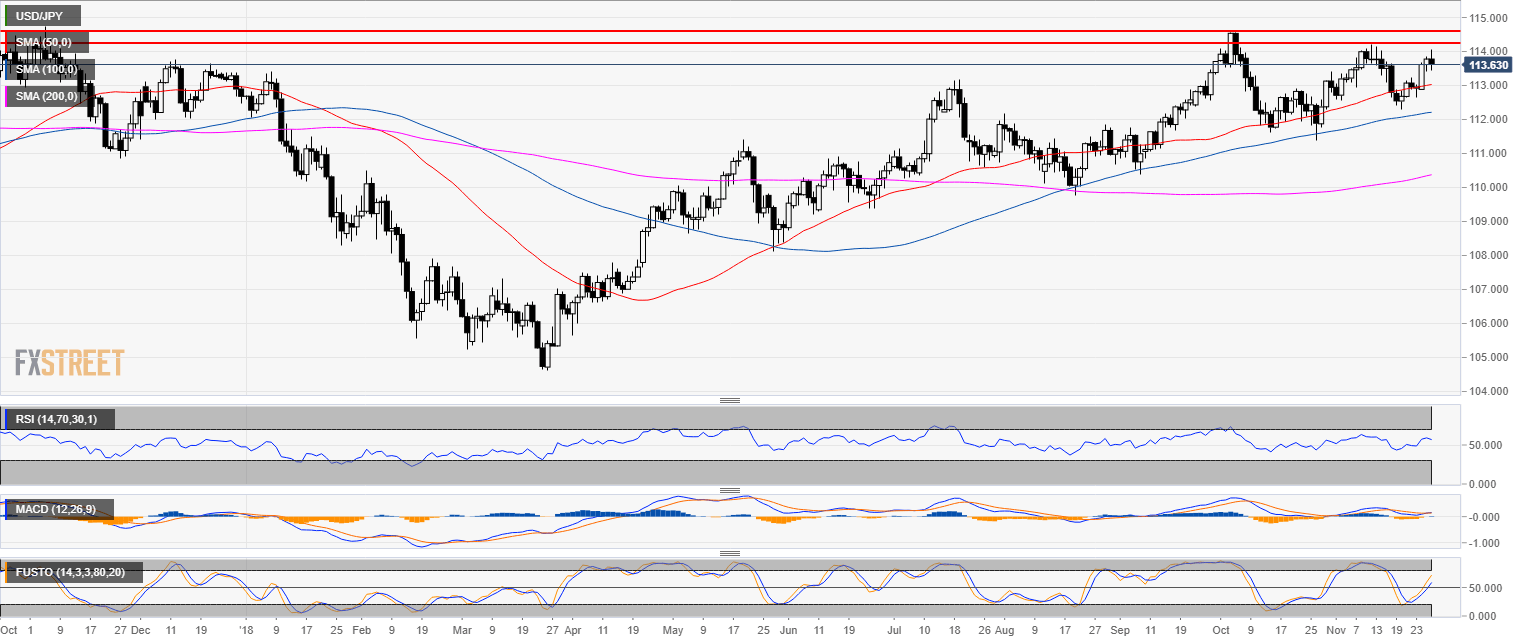
USD/JPY daily chart
- USD/JPY is trading in a bull trend above its main simple moving averages (SMAs).
- The RSI and stochastic are trading above the 50 line while the MAVCD is decelerating.
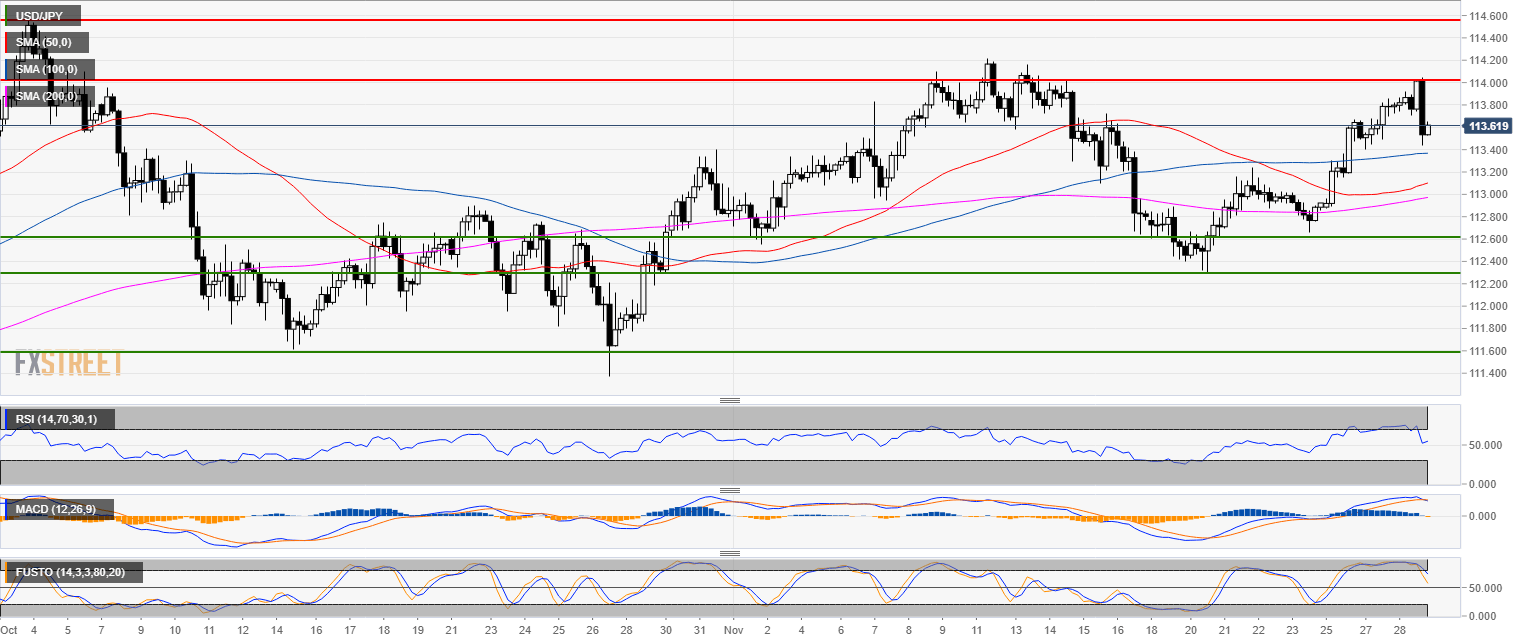
USD/JPY 4-hour chart
- USD/JPY sold off 60 pips on the back of comments from Fed’s Powell strongly rejecting the 114.00 figure in the process.
- Key support is seen all the way back down to 112.60.
- Technical indicators are decelerating suggesting that the market might slow down below the 114.00 figure.
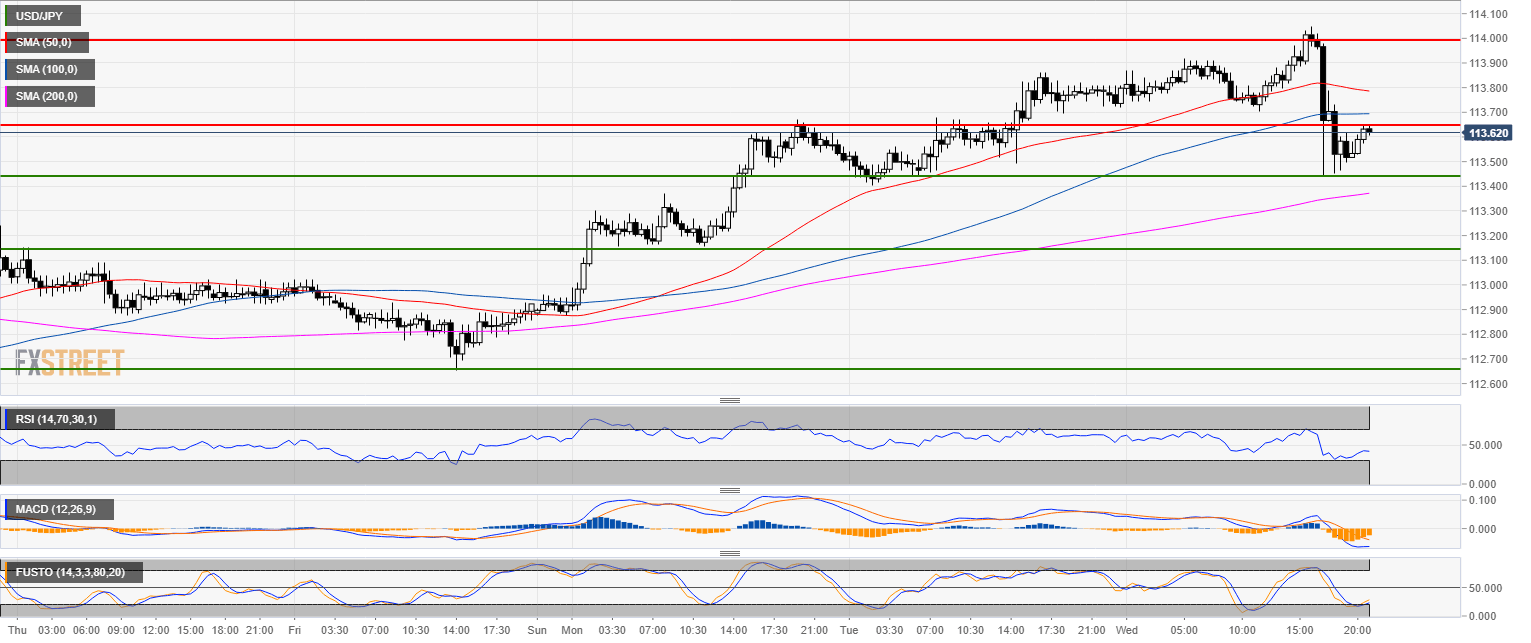
USD/JPY 30-minute chart
- USD/JPY broke below the 50 and 100 SMA as technical indicators turned bearish.
- If the bears keep the momentum going the next key target to the downside is seen at the 113.15 level.
Additional key levels
USD/JPY
Overview:
Today Last Price: 113.63
Today Daily change: -15 pips
Today Daily change %: -0.132%
Today Daily Open: 113.78
Trends:
Previous Daily SMA20: 113.29
Previous Daily SMA50: 113
Previous Daily SMA100: 112.2
Previous Daily SMA200: 110.33
Levels:
Previous Daily High: 113.84
Previous Daily Low: 113.41
Previous Weekly High: 113.24
Previous Weekly Low: 112.3
Previous Monthly High: 114.56
Previous Monthly Low: 111.38
Previous Daily Fibonacci 38.2%: 113.68
Previous Daily Fibonacci 61.8%: 113.58
Previous Daily Pivot Point S1: 113.51
Previous Daily Pivot Point S2: 113.24
Previous Daily Pivot Point S3: 113.08
Previous Daily Pivot Point R1: 113.94
Previous Daily Pivot Point R2: 114.11
Previous Daily Pivot Point R3: 114.38
