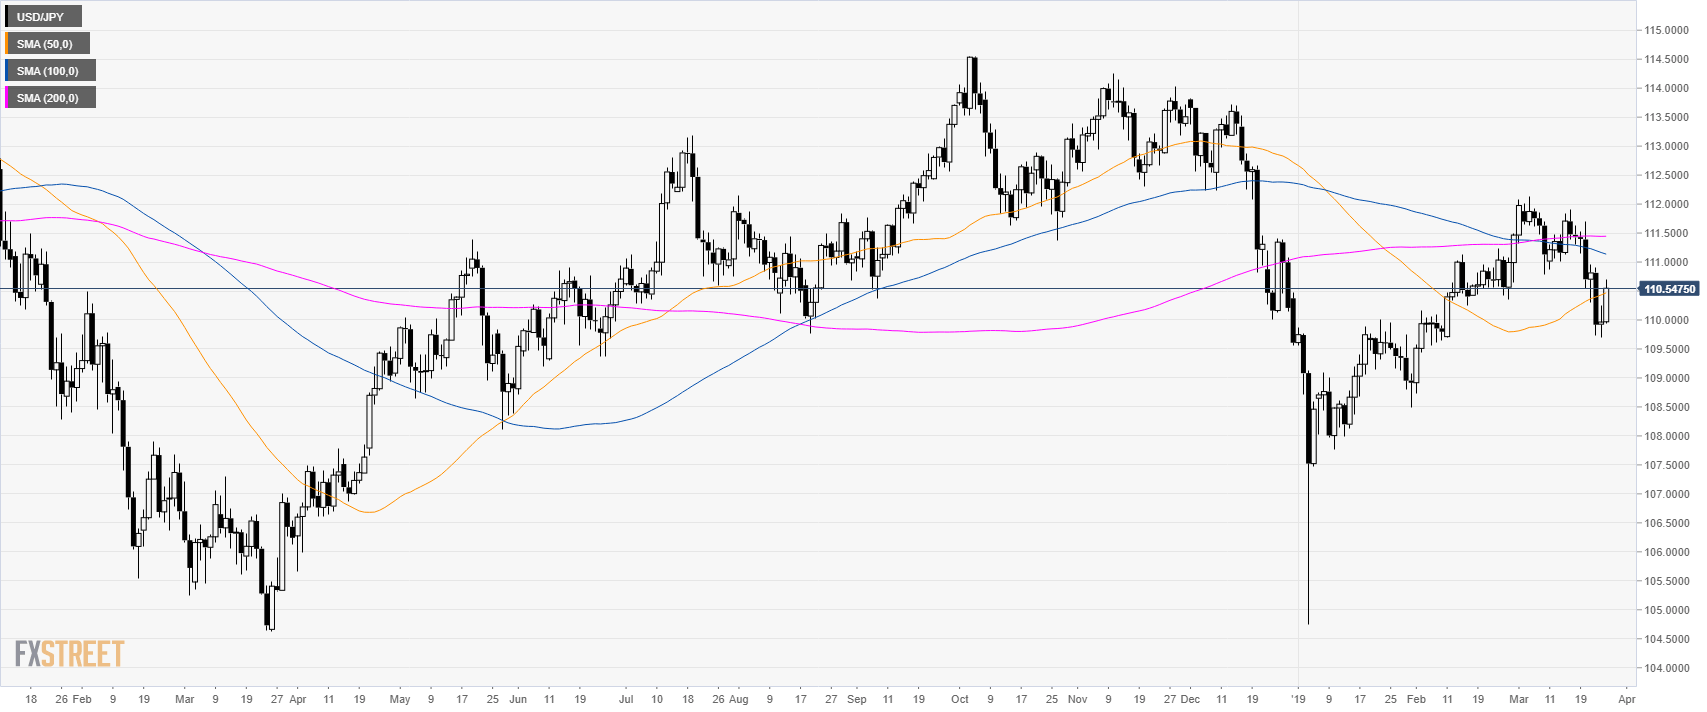
USD/JPY daily chart
- USD/JPY is trading below its 100 and 200-day simple moving averages (SMAs) suggesting bearish momentum.
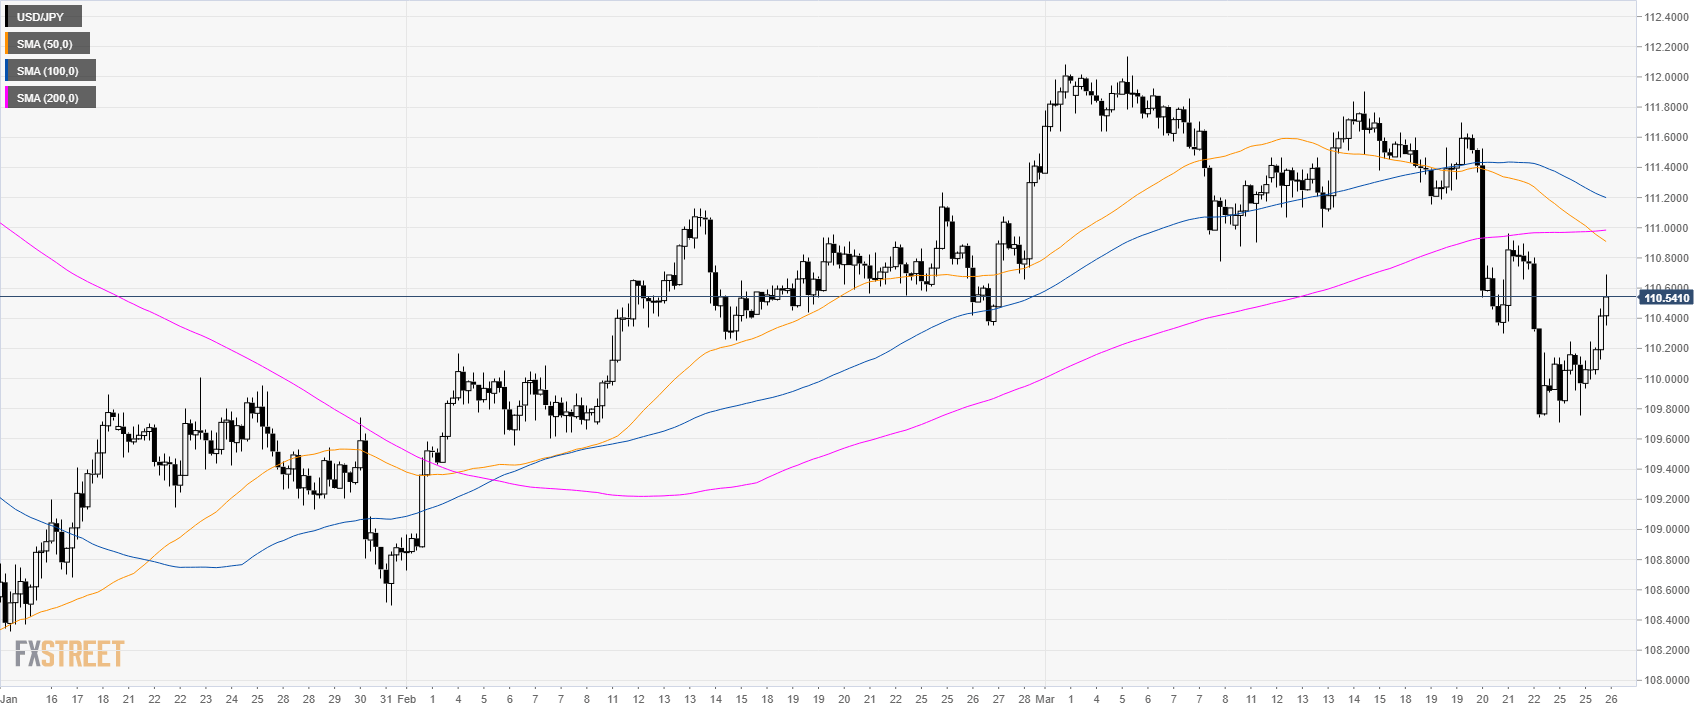
USD/JPY 4-hour chart
- USD/JPY is trading below its main SMAs suggesting a bearish bias in the medium-term.
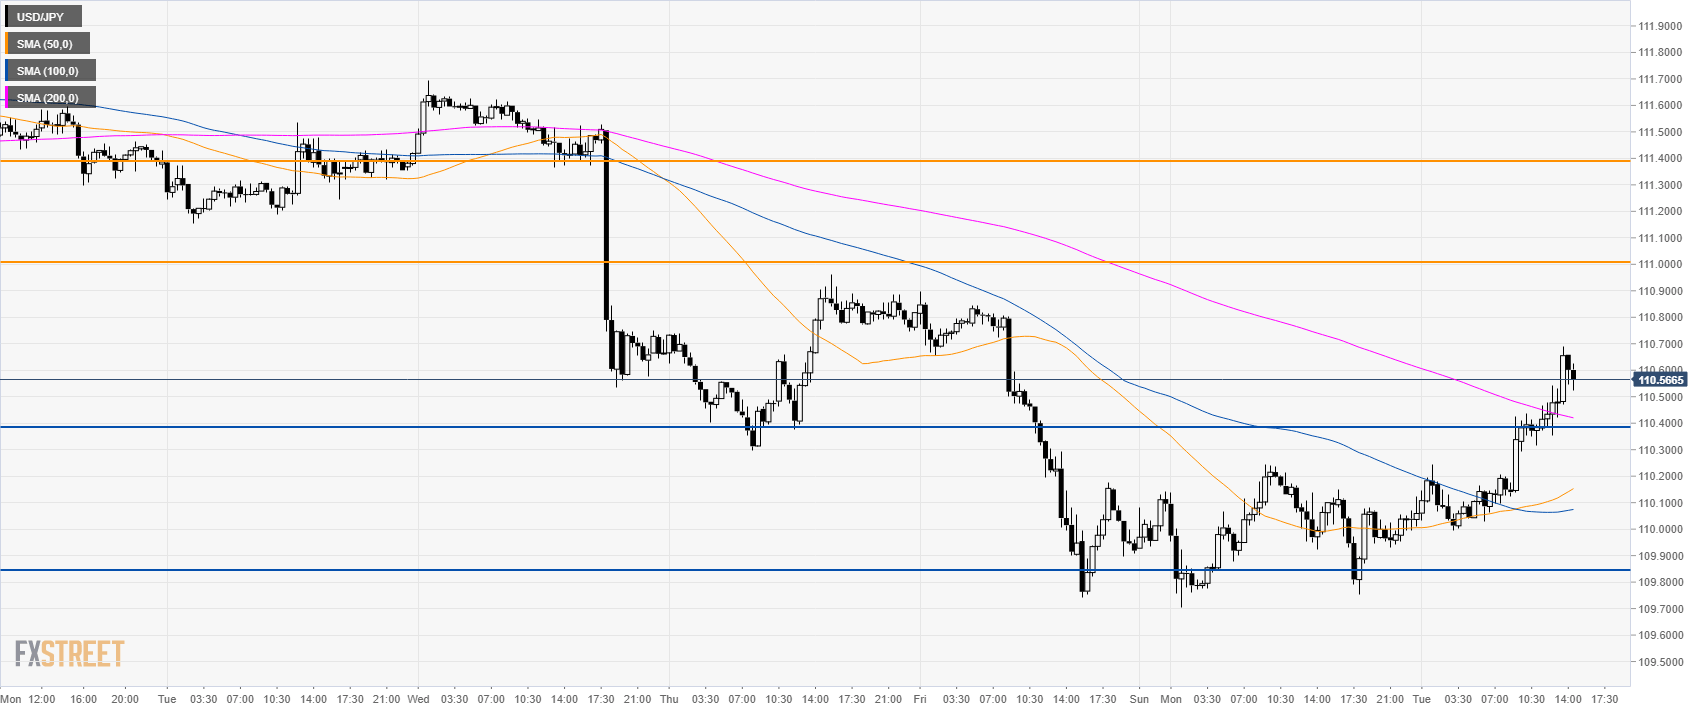
USD/JPY 30-minute chart
- USD/JPY is trading above its main SMAs suggesting bullish momentum in the short-term.
- The current bull strength can lead to a move up to 111.00 resistance.
- To the downside, support is at 110.40 and 110.85 level.
Additional key levels
