- USD/JPY is trading at daily lows after the London close this Tuesday.
- The level to beat for bears is 108.50, followed by the 108.27 level.
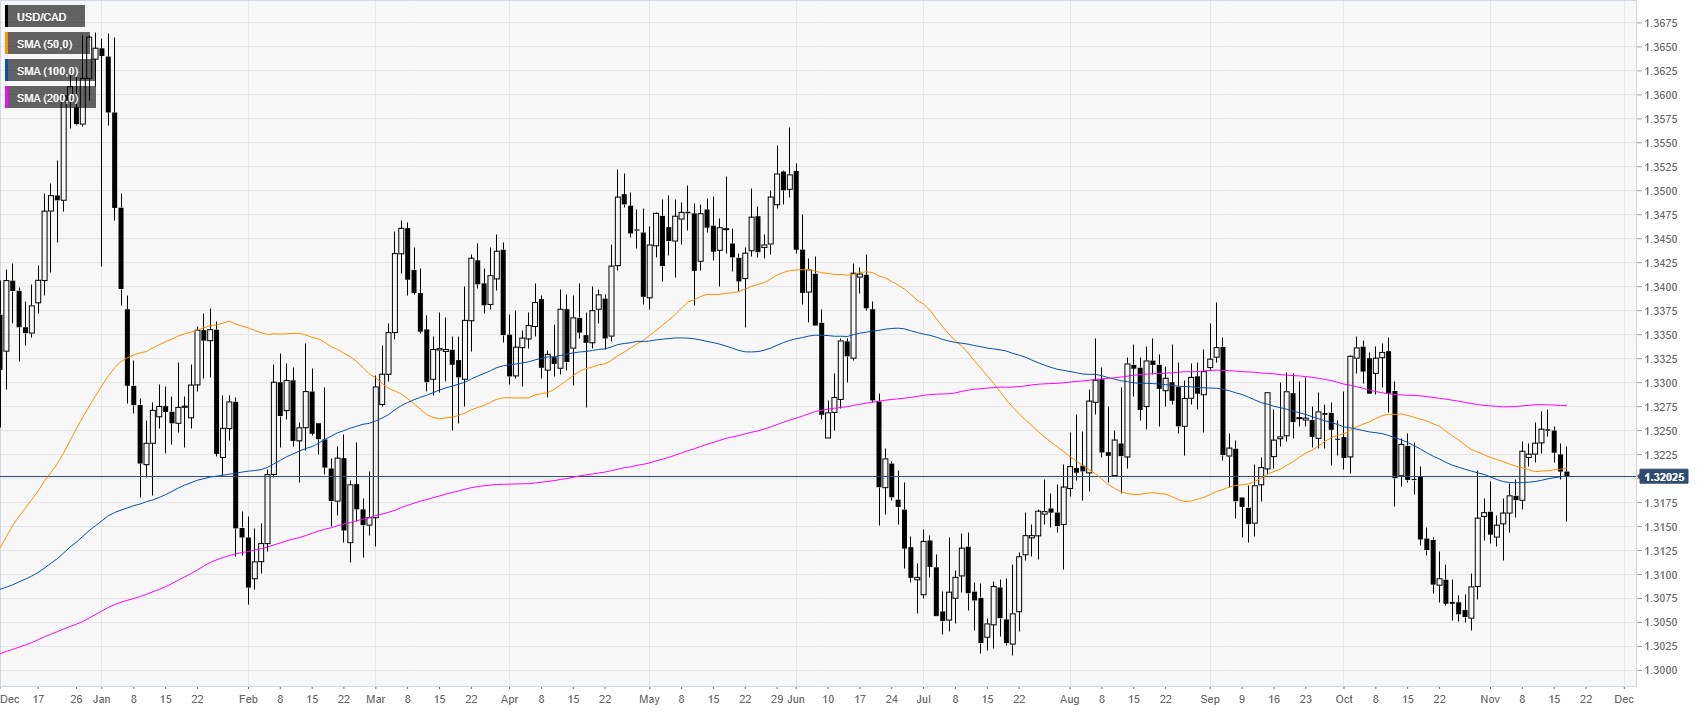
USD/JPY daily chart
USD/JPY is ranging below the 109.00 figure and the 200-day simple moving average (DMA) on the daily chart. In the last two months, the spot has been accelerating on the way up.
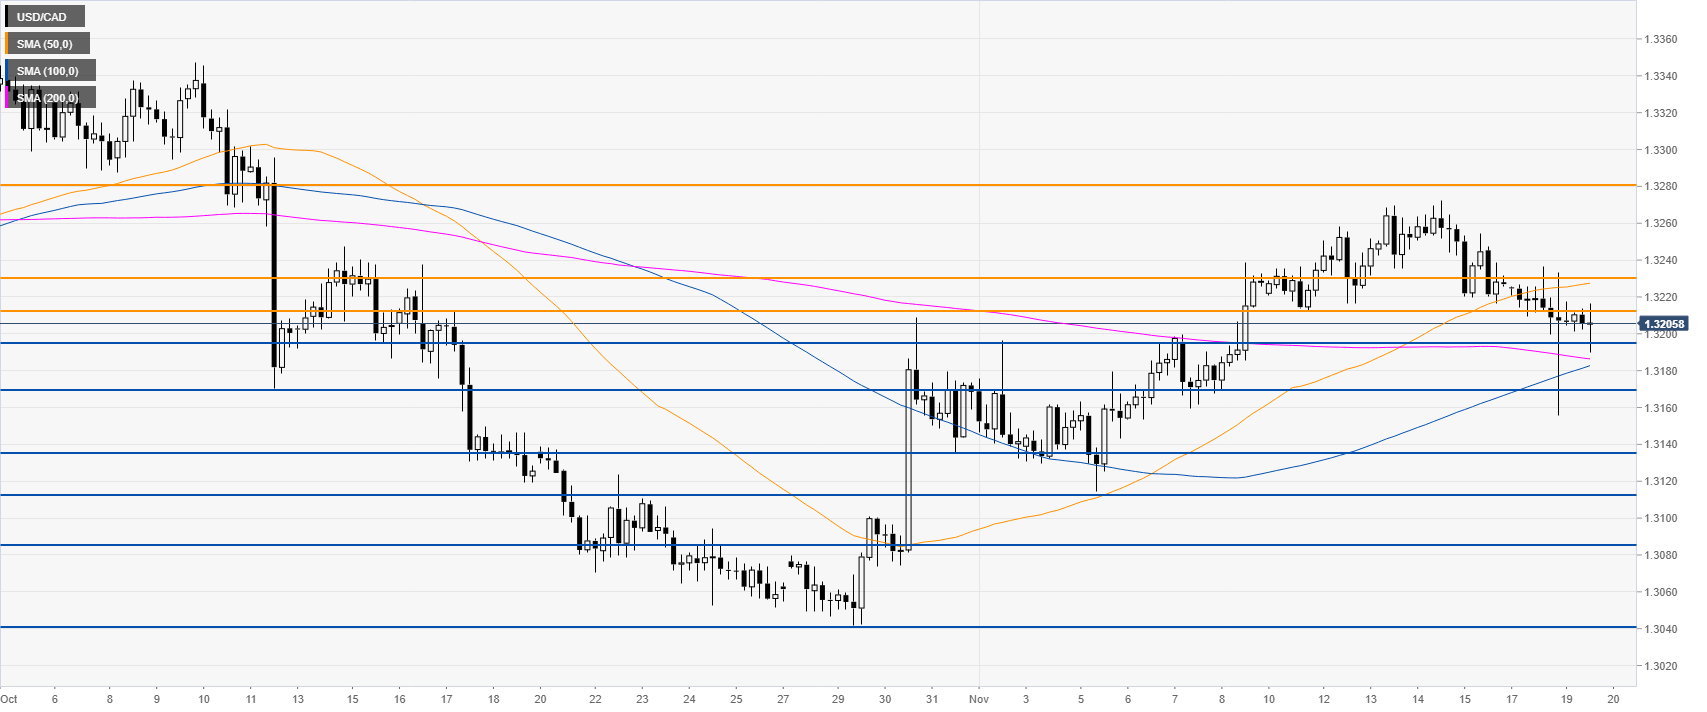
USD/JPY four-hour chart
USD/JPY is challenging the 108.50 level and the 200 SMA. A break below this level can lead to a potential decline near the 108.27 swing low.
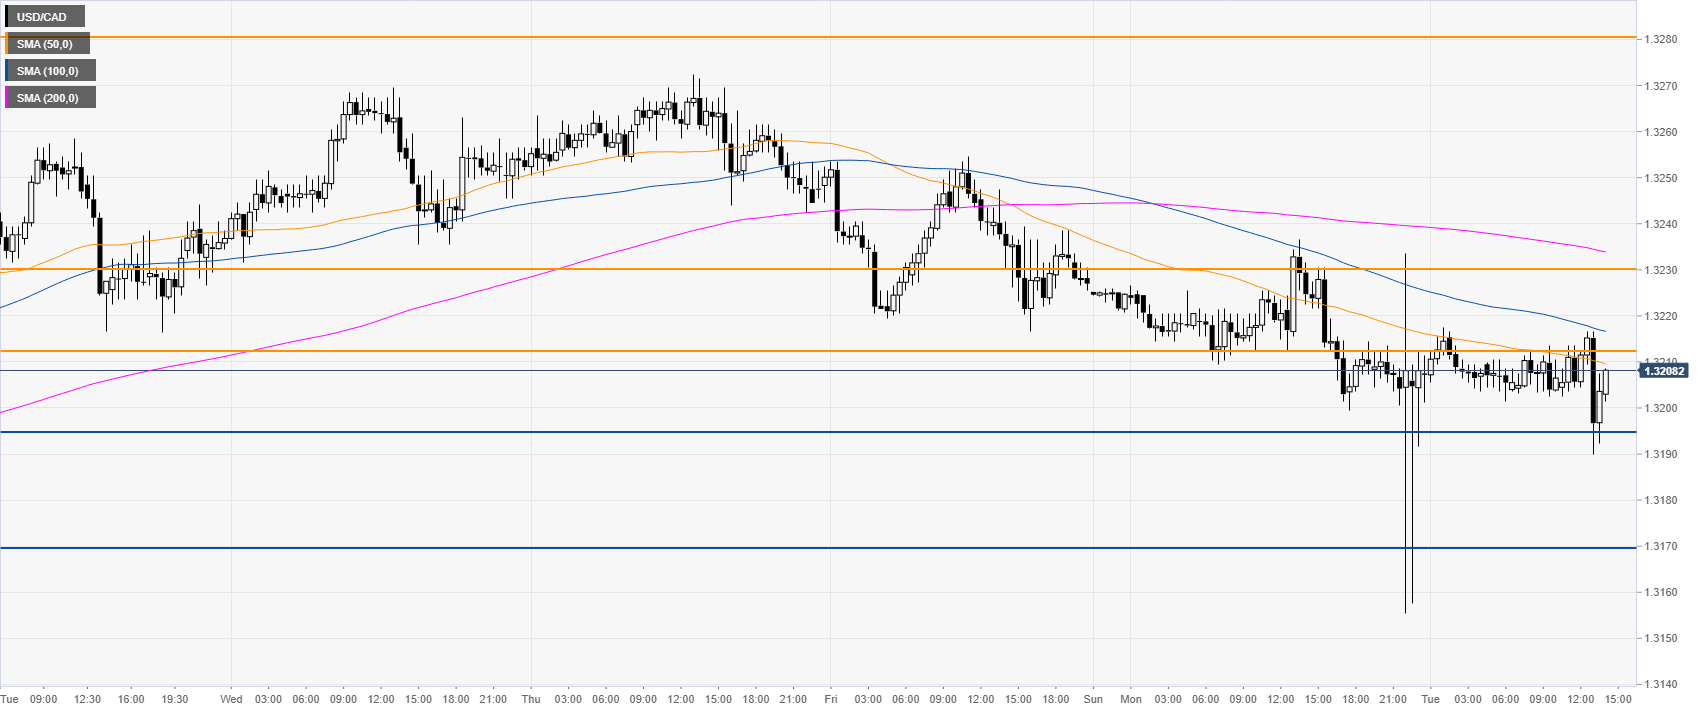
USD/JPY 30-minute chart
USD/JPY is trading below the main SMAs on the 30-minute chart suggesting a bearish bias in the near term. Resistance is seen near 108.75, 108.94, 109.05 and 109.35 levels, according to the Technical Confluences Indicator.
Additional key levels
