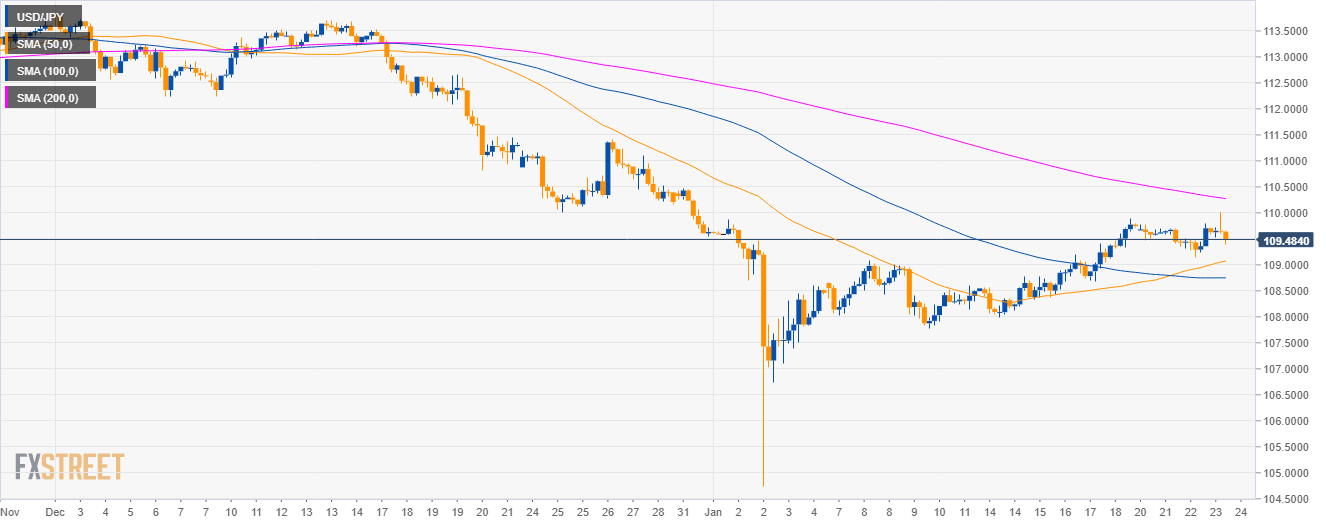
USD/JPY daily chart
- USD/JPY is trading in a deep pullback below the 50, 100 and 200-day simple moving averages (SMAs).
-636838614256224263.png)
USD/JPY 4-hour chart
- USD/JPY is trading below its 200 SMA.
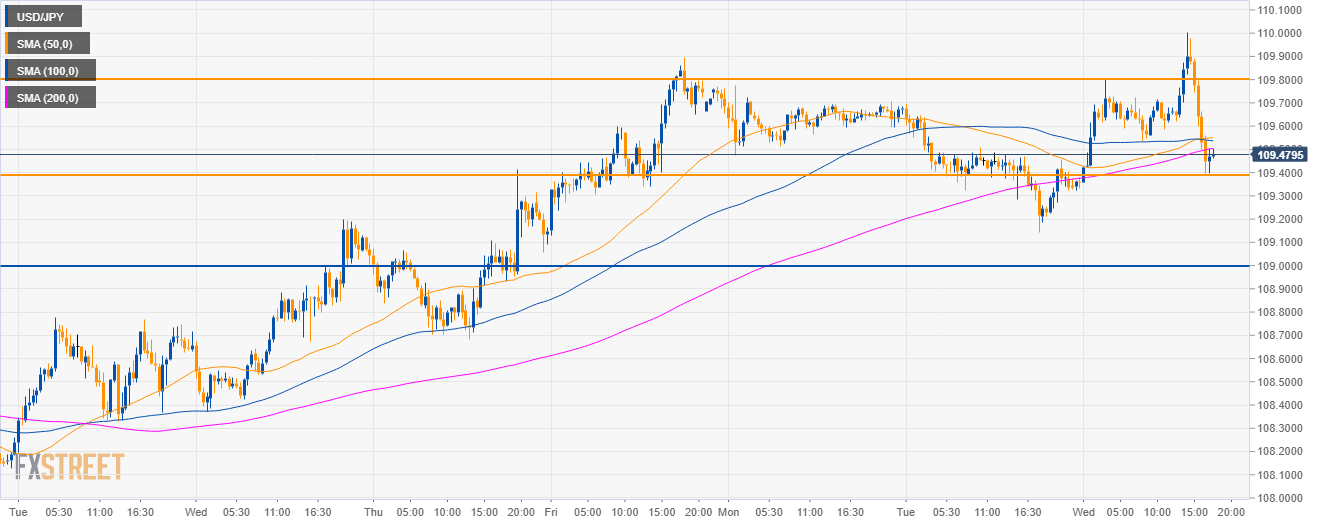
USD/JPY 30-minute chart
- USD/JPY is challenging the 109.40 support and the main SMAs.
- If bulls lose the 109.40 support then a drop to 109.00 can be on the cards.
Additional key levels
USD/JPY
Overview:
Today Last Price: 109.47
Today Daily change: 6 pips
Today Daily change %: 0.05%
Today Daily Open: 109.41
Trends:
Daily SMA20: 109.17
Daily SMA50: 111.37
Daily SMA100: 112.03
Daily SMA200: 111.21
Levels:
Previous Daily High: 109.7
Previous Daily Low: 109.14
Previous Weekly High: 109.9
Previous Weekly Low: 107.99
Previous Monthly High: 113.83
Previous Monthly Low: 109.55
Daily Fibonacci 38.2%: 109.36
Daily Fibonacci 61.8%: 109.49
Daily Pivot Point S1: 109.14
Daily Pivot Point S2: 108.86
Daily Pivot Point S3: 108.57
Daily Pivot Point R1: 109.7
Daily Pivot Point R2: 109.98
Daily Pivot Point R3: 110.26
