- USD/JPY is consolidating after the recent 280-pip drop.
- USD/JPY bulls will need to overcome the 200-period simple moving average or else a small pullback towards 112.00 can be on the cards. The RSI and MACD indicators are constructive however the Stochastic is already in overbought condition.
- A break above the 200 SMA and 112.55 should open the doors to 113.00 figure.
USD/JPY 4-hour chart
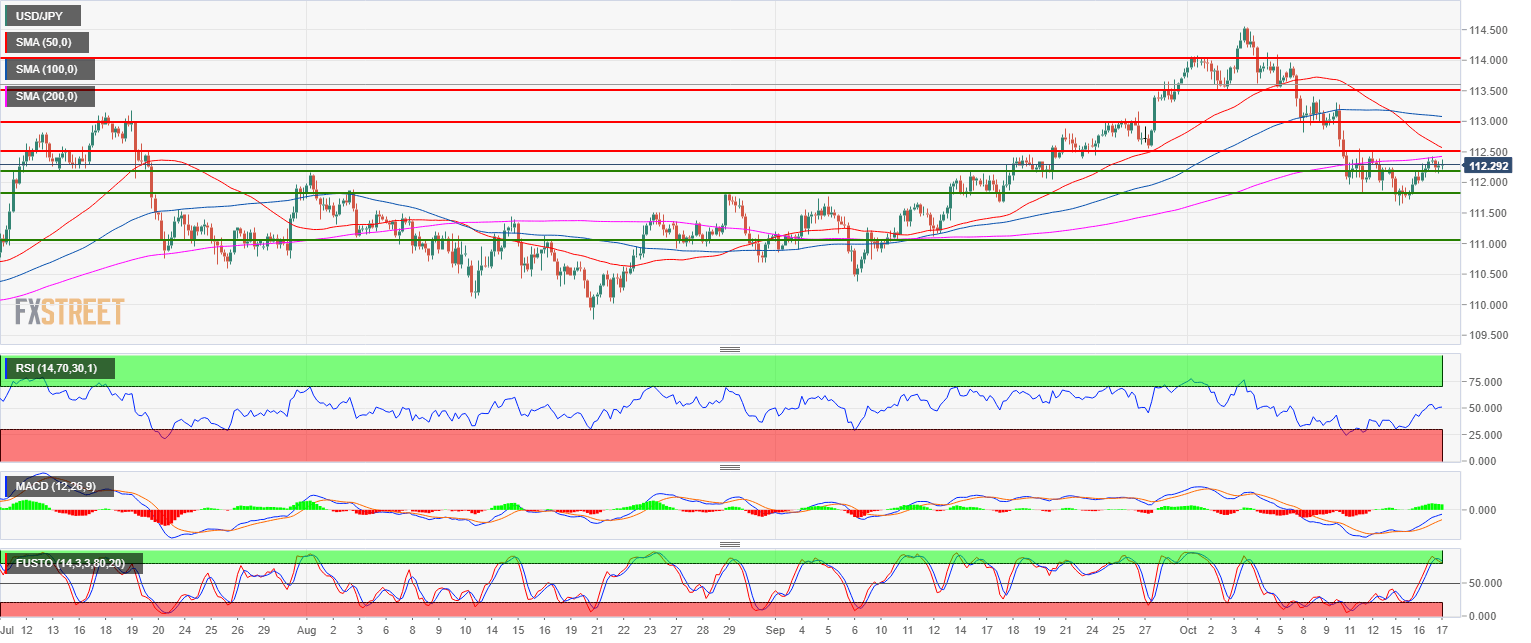
Spot rate: 112.28
Relative change: 0.03%
High: 112.43
Low: 112.15
Main trend: Bullish
Resistance 1: 112.55 September 27 low
Resistance 2: 113.00 figure
Resistance 3: 113.55 October 2 low
Resistance 4: 113.55 October 2 low
Resistance 5: 114.00 figure
Resistance 6: 114.80 November 2017 high
Resistance 7: 115.50 March 10, 2017 high
Support 1: 112.00-112.17 zone, figure and August 1 swing high
Support 2: 111.84 August 29 swing high
Support 3: 111.00 figure
