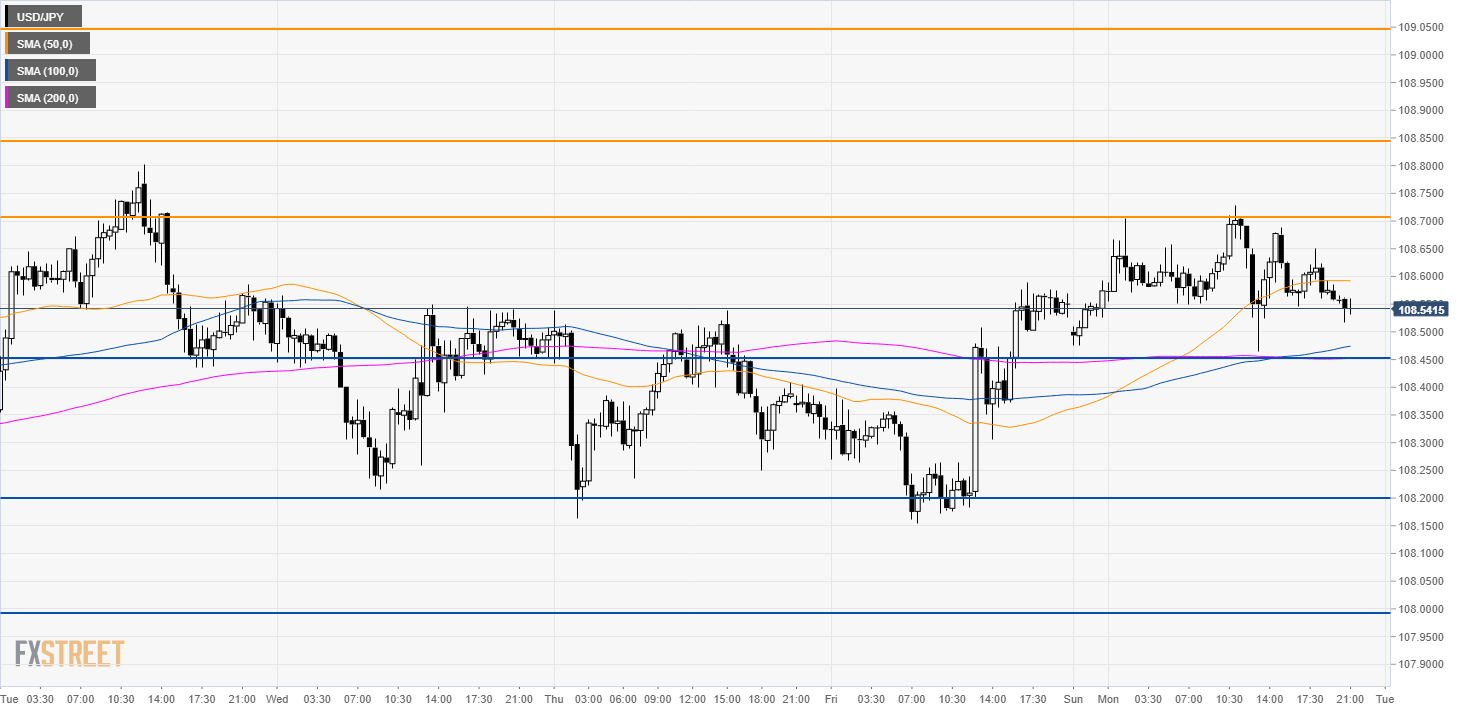
- USD/JPY is trapped in a tight range between 108.20 and 108.80.
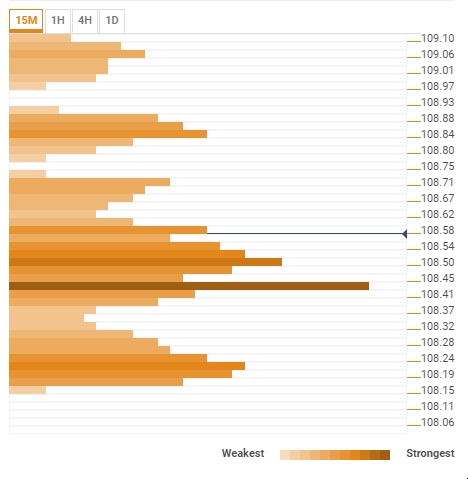
- A drop below 108.45 support can lead to 108.20 according to the Technical Confluences Indicator.
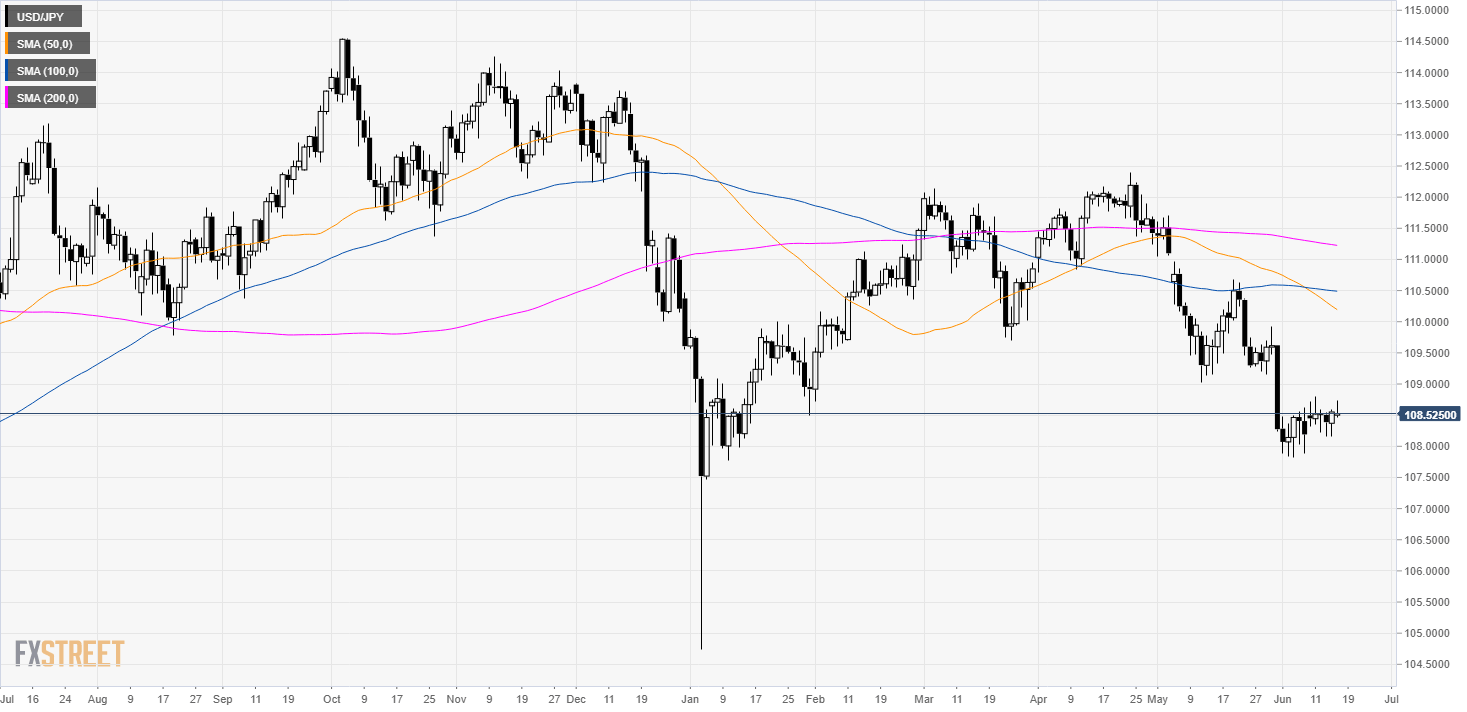
USD/JPY daily chart
USD/JPY is trading in a bear trend below its main daily simple moving averages (DSMAs). The 50 SMA crossed below the 100 SMA which is a bearish sign.

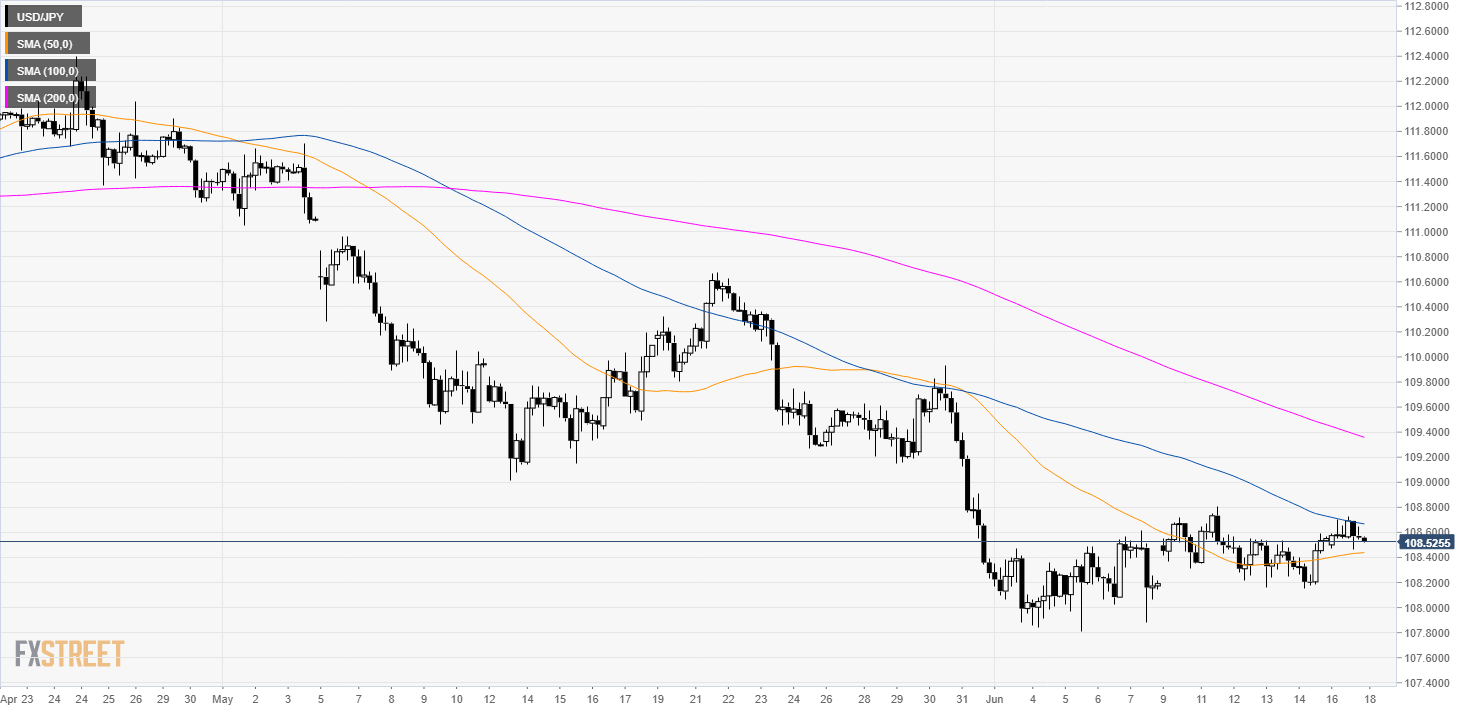
USD/JPY 4-hour chart
USD/JPY is consolidating in the 108.20-108.80 range trapped between the 50 and 100 SMAs.
USD/JPY 30-minute chart
According to the Technical Confluences Indicator, there is strong support at 108.45 which is the daily Fibonacci 38.2%, the 200 SMA on the 1-hour and the 50 SMA on the 4-hour. If this level is broken to the downside the market could fall to the next level of confluence which is seen near the 108.20 level, the weekly pivot point support 1.
On the flip side, bulls will try to overcome 108.70 to reach 108.84 (near previous week high and the weekly pivot point resistance 1). The next resistance is seen at 109.05 (Monthly Fibonacci of 23.6%).
Technical Confluences Indicator

Additional key levels