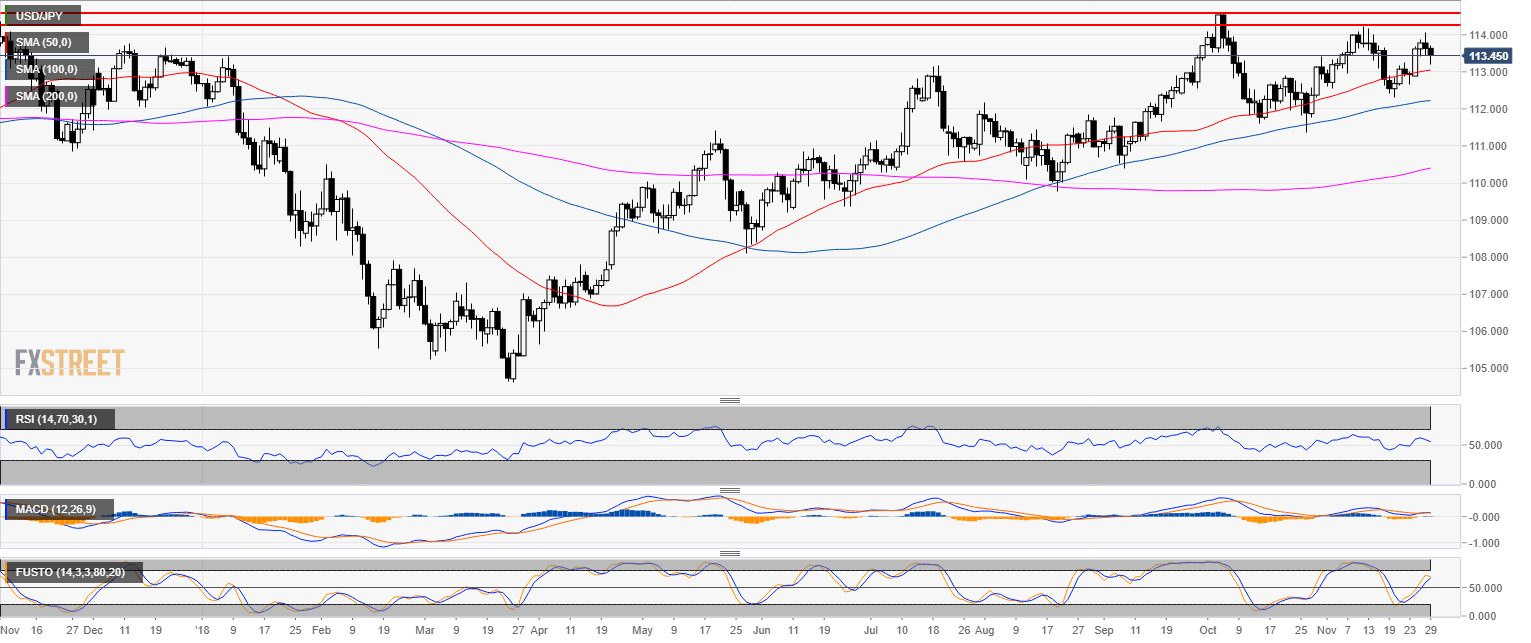
USD/JPY daily chart
- USD/JPY is trading in a bull trend above the 200-day simple moving average (SMA).
- The FOMC minutes were essentially a non-event with almost no market reaction.
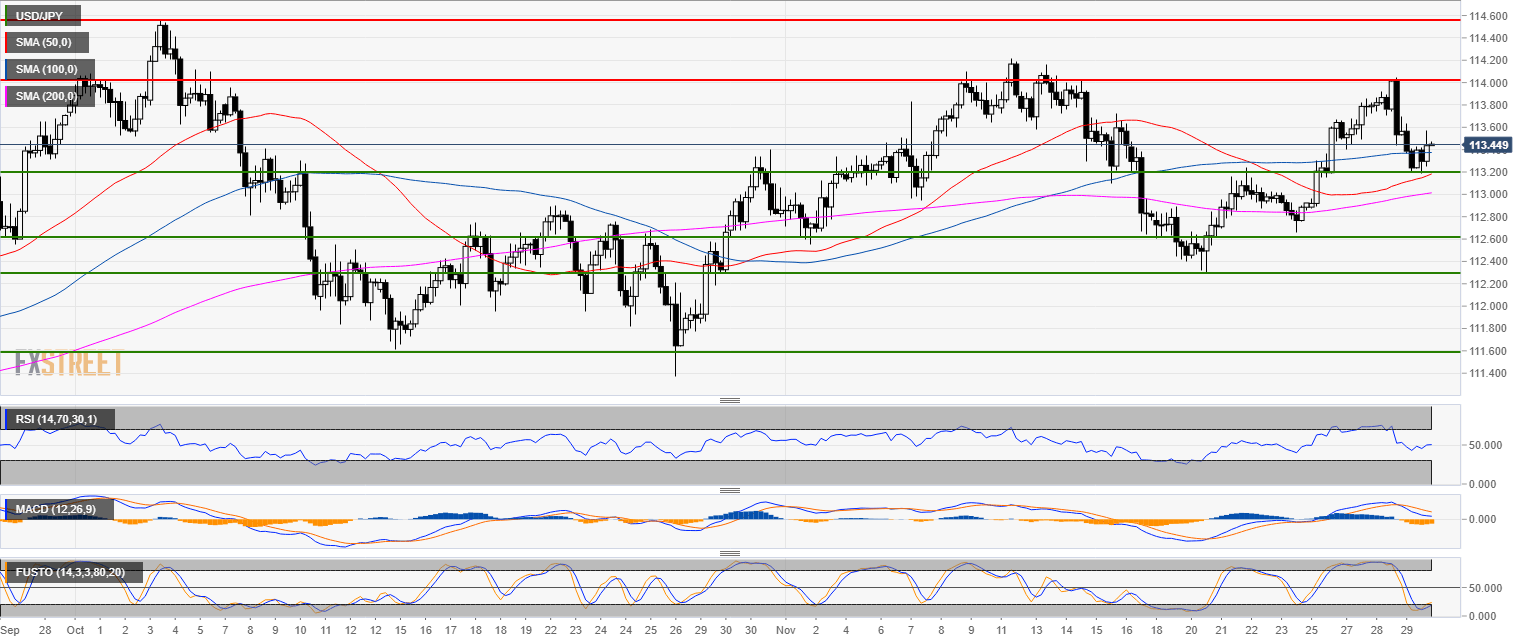
USD/JPY 4-hour chart
- USD/JPY is likely capped below 113.60.
- Technical indicators are suggesting lower prices ahead with 113.20 and 112.60 as potential targets.
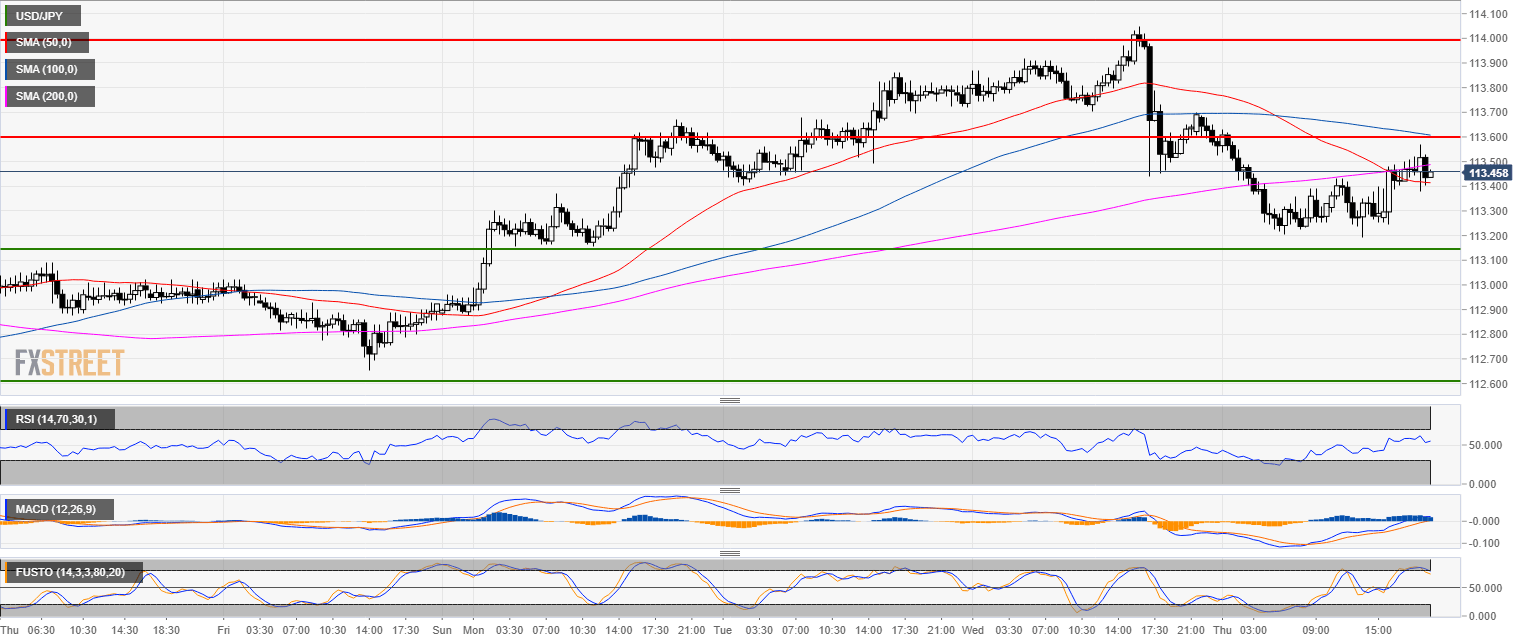
USD/JPY 30-minute chart
- USD/JPY is finding resistance at the 200 SMA.
Additional key levels
USD/JPY
Overview:
Today Last Price: 113.46
Today Daily change: -17 pips
Today Daily change %: -0.150%
Today Daily Open: 113.63
Trends:
Previous Daily SMA20: 113.33
Previous Daily SMA50: 113.03
Previous Daily SMA100: 112.21
Previous Daily SMA200: 110.37
Levels:
Previous Daily High: 114.04
Previous Daily Low: 113.44
Previous Weekly High: 113.24
Previous Weekly Low: 112.3
Previous Monthly High: 114.56
Previous Monthly Low: 111.38
Previous Daily Fibonacci 38.2%: 113.67
Previous Daily Fibonacci 61.8%: 113.81
Previous Daily Pivot Point S1: 113.37
Previous Daily Pivot Point S2: 113.1
Previous Daily Pivot Point S3: 112.77
Previous Daily Pivot Point R1: 113.97
Previous Daily Pivot Point R2: 114.3
Previous Daily Pivot Point R3: 114.57
