- USD/JPY is off the daily lows as the market is trying to break away from the 106.14 level.
- The levels to beat for bulls are at the 106.31 and 106.69 levels, according to the Technical Confluences Indicator.
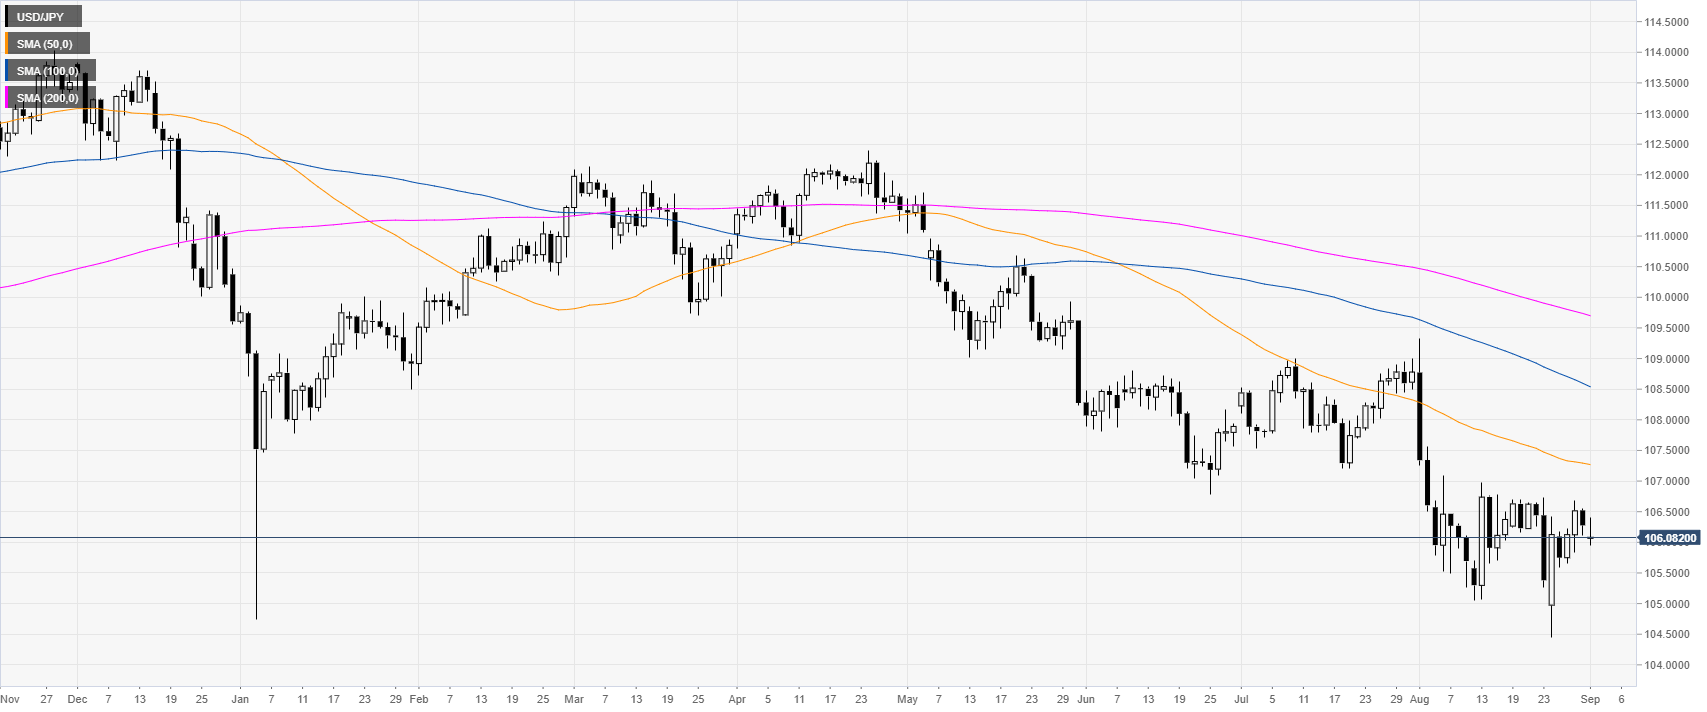
USD/JPY daily chart
USD/JPY is trading in a bear trend below its main daily simple moving averages (DSMAs). The market is holding just above the 106.00 handle as the bear trend is currently on hold.
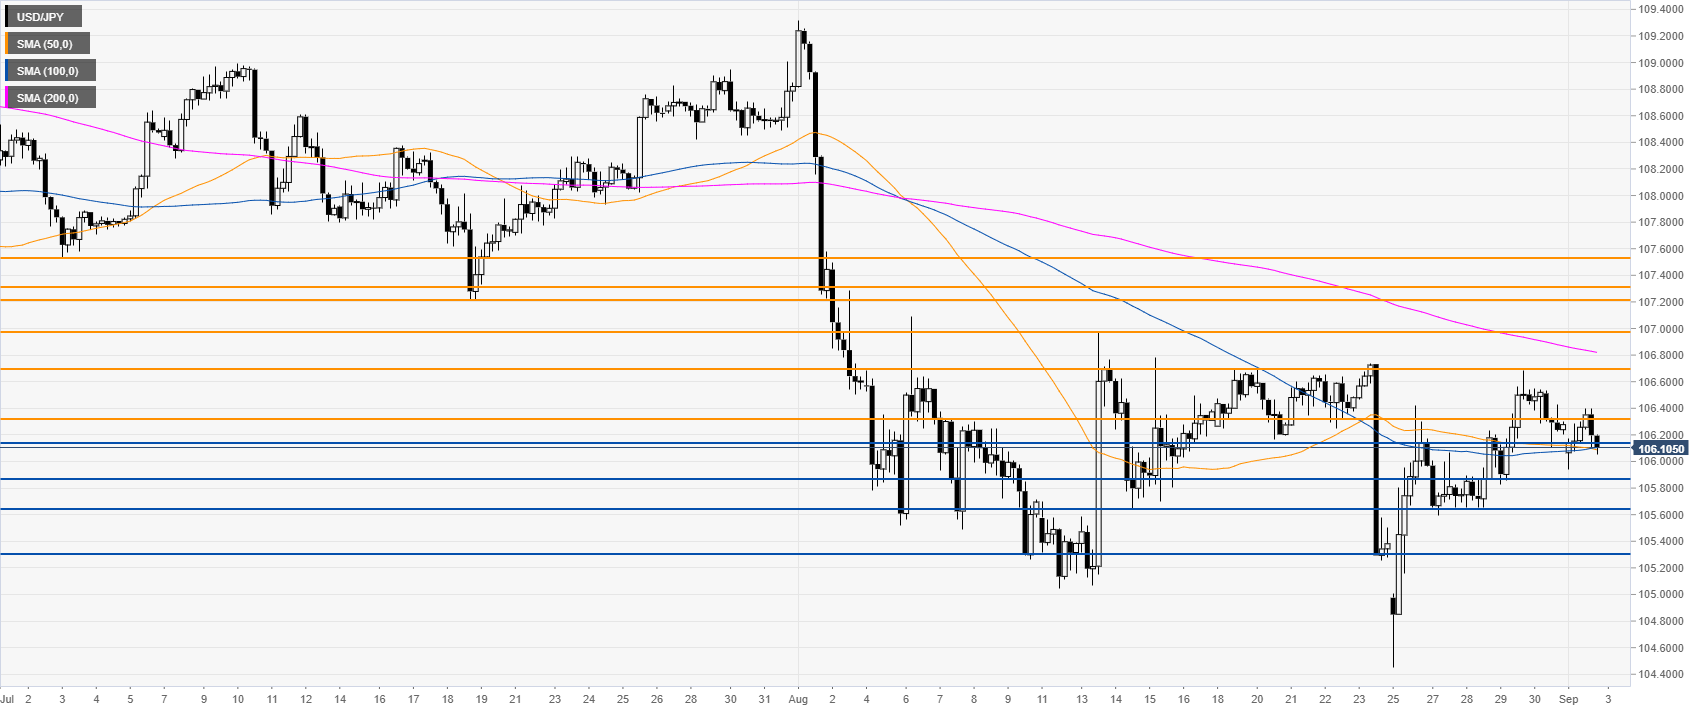
USD/JPY 4-hour chart
USD/JPY is challenging the 106.14 support zone and the 50/100 SMAs. Bears would need a daily close below the level to drive the market down towards 105.86, 105.64 and 105.31 support levels, according to the Technical Confluences Indicator.
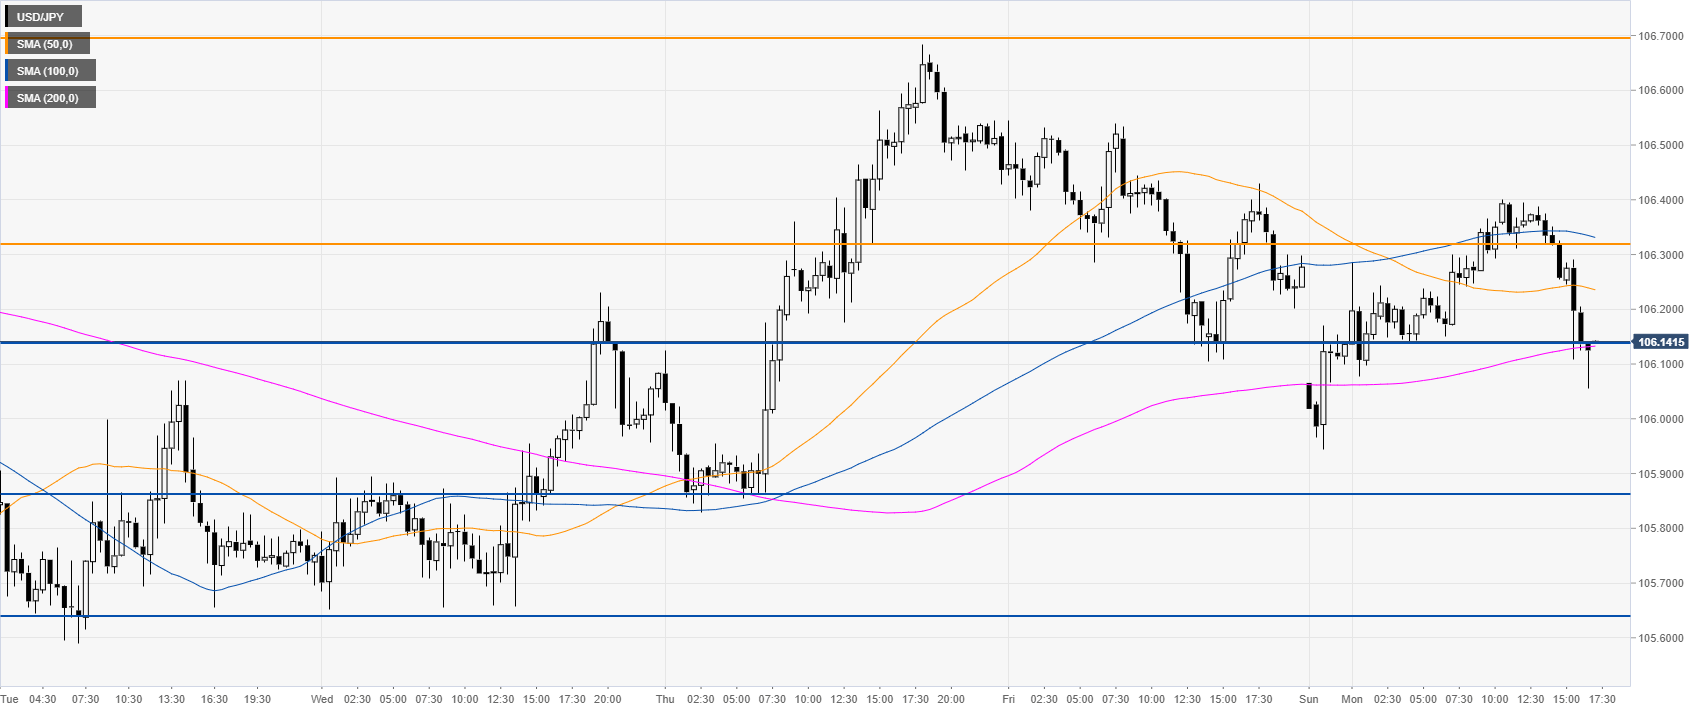
USD/JPY 30-minute chart
Dollar/Yen is pulling back below its SMAs, suggesting a consolidation in the near term. Bulls would need to reclaim 106.31 and 106.69 levels if they intend, in the coming weeks, generate an attack towards 106.97, 107.19/107.30, 107.53 the according to the Technical Confluences Indicator.
Additional key levels
