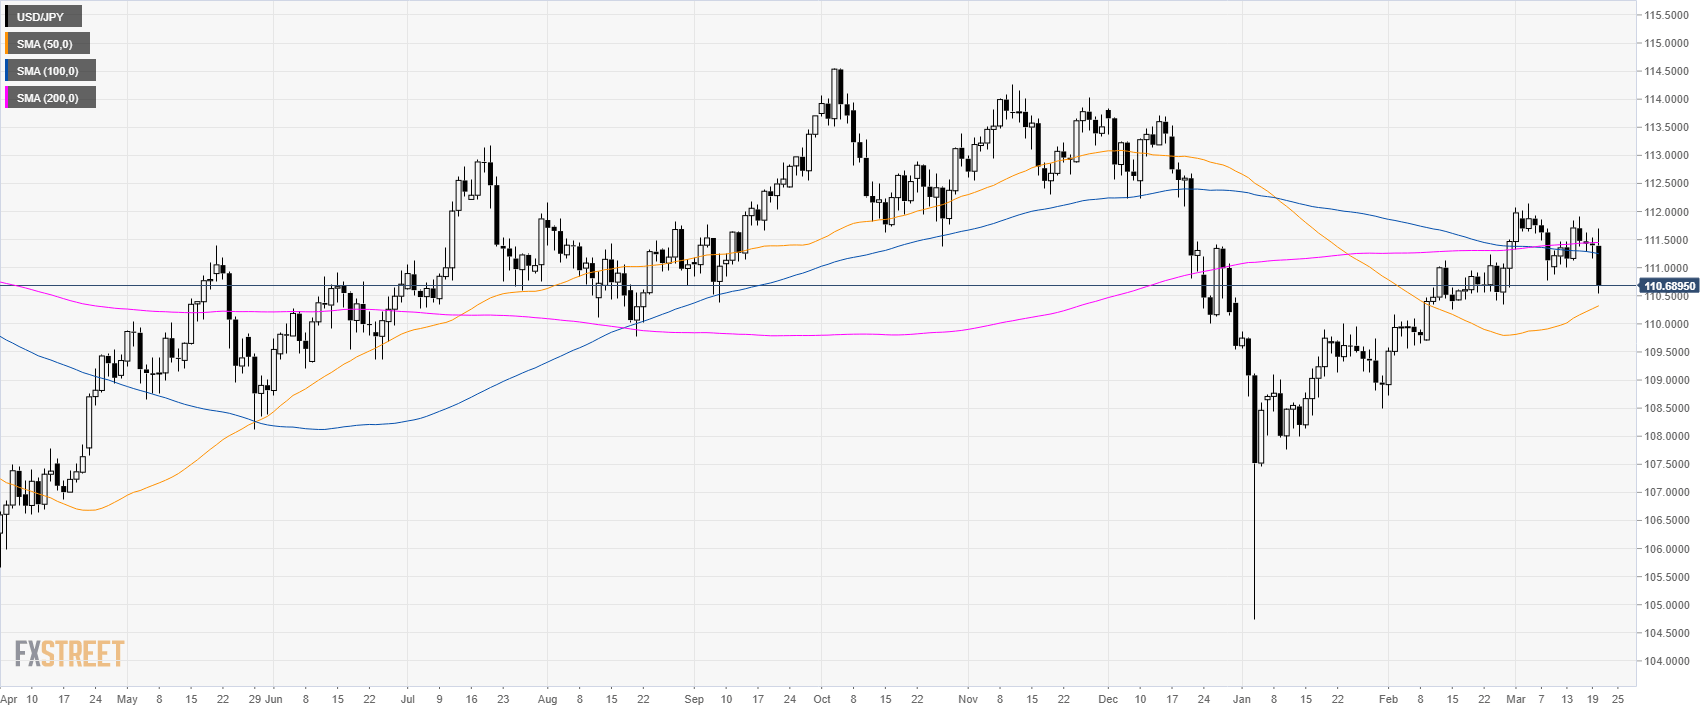
USD/JPY daily chart
- USD/JPY is trading below the 100 and 200 SMAs suggesting bearish momentum.
- The FOMC was much more dovish than expected sending USD down across the board.
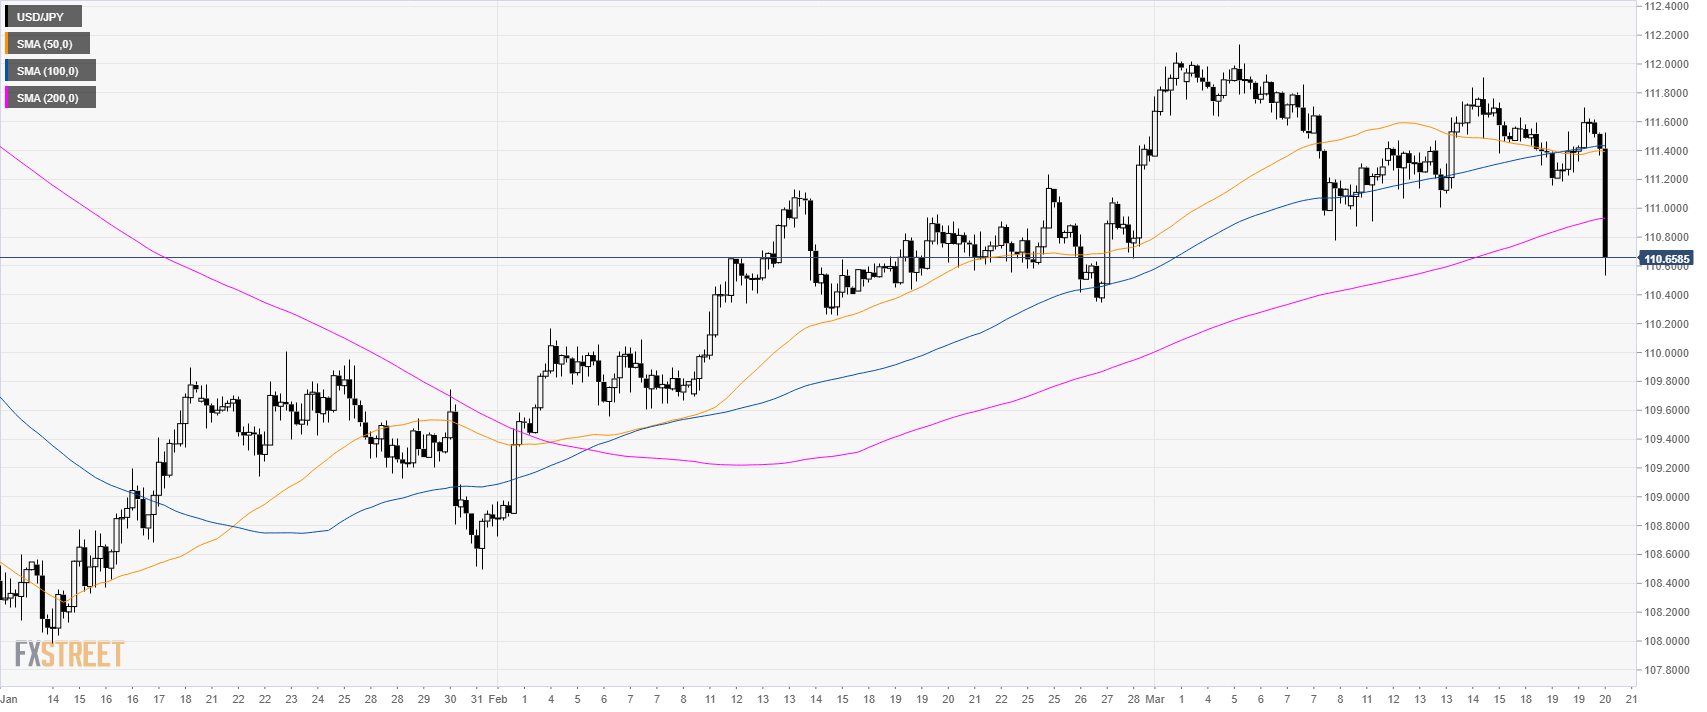
USD/JPY 4-hour chart
- USD/JPY is trading below its main SMAs suggesting bearish momentum in the medium-term.
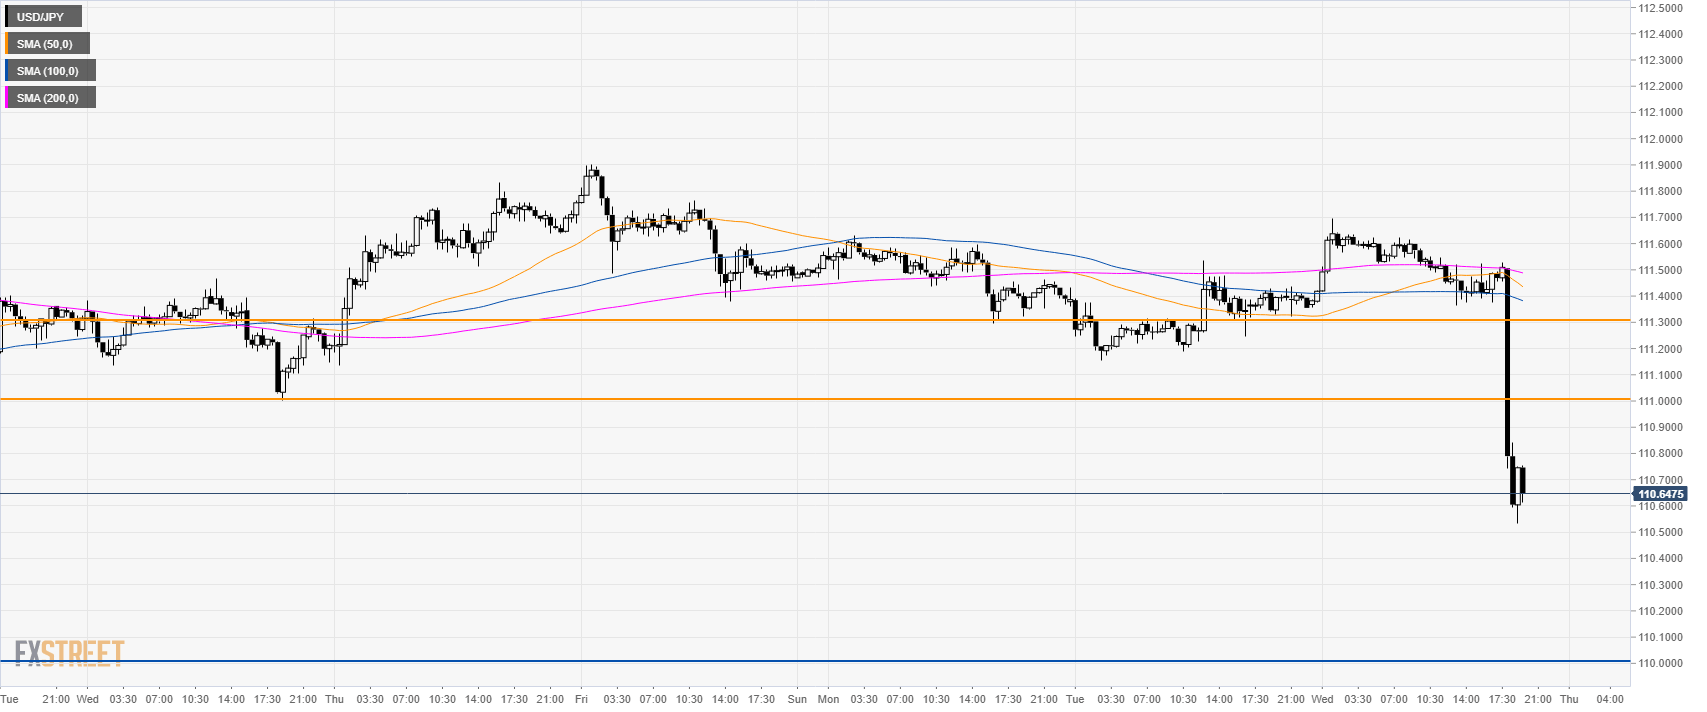
USD/JPY 30-minute chart
- USD/JPY is trading below its main SMAs suggesting bearish momentum in the short-term.
- The next key support is at the 110.00 level.
- Resistances are at 111.00 and 111.30 level.
Additional key levels
