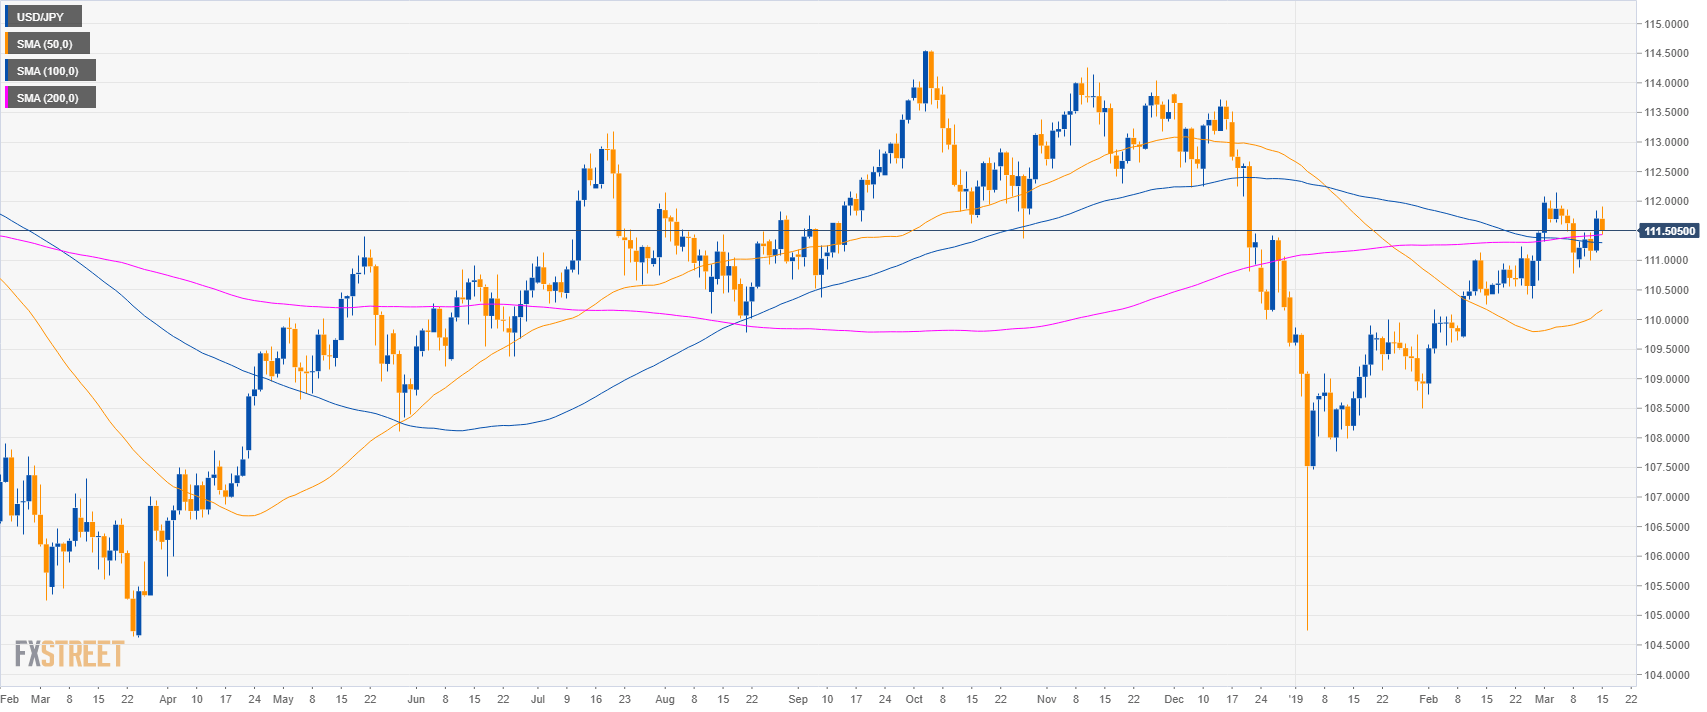
USD/JPY daily chart
- USD/JPY is trading above its main simple moving averages (SMAs) suggesting a bullish bias.
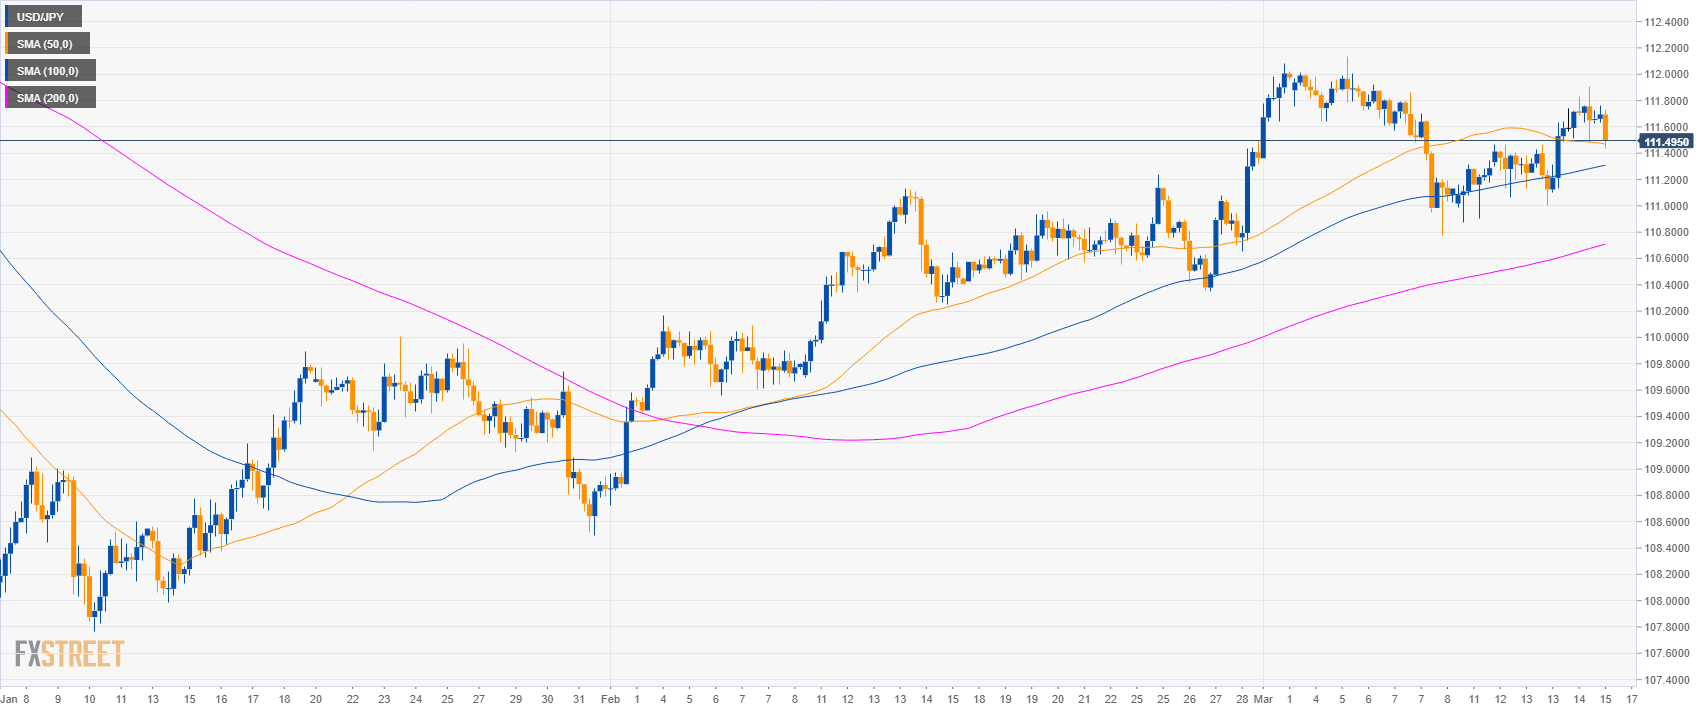
USD/JPY 4-hour chart
- USD/JPY is trading above its main SMAs suggesting bullish momentum in the medium-term.
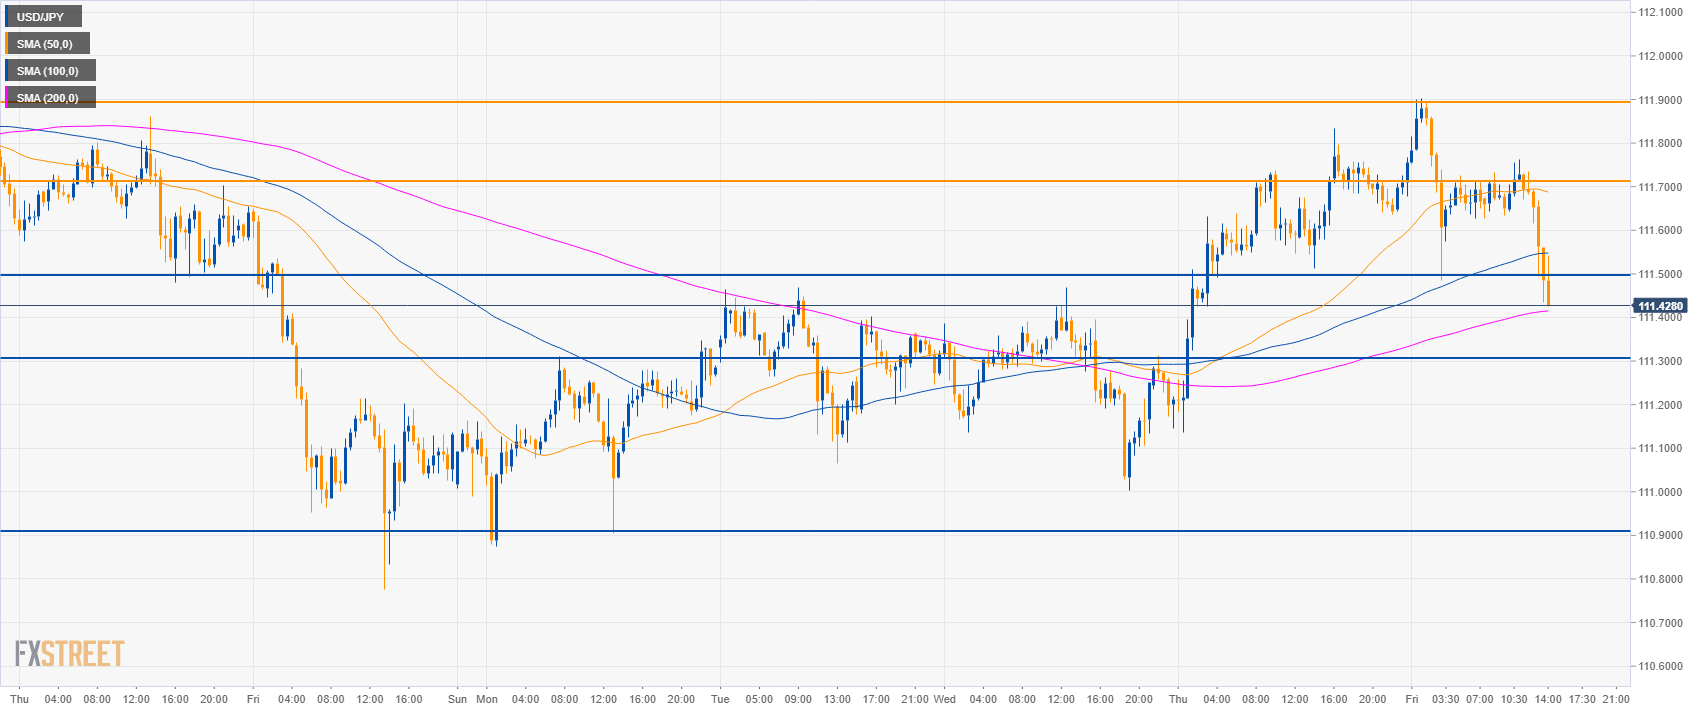
USD/JPY 30-minute chart
- USD/JPY is trading between the 100 and 200 SMAs suggesting a consolidation in the short-term.
- A break below 111.50 can lead to 113.30 key support. Further down, 110.90 is the next support.
- Resistances are at 111.70 and 111.90 level.
Additional key levels
USD/JPY
Overview:
Today Last Price: 111.48
Today Daily change: -23 pips
Today Daily change %: -0.21%
Today Daily Open: 111.71
Trends:
Daily SMA20: 111.17
Daily SMA50: 110.1
Daily SMA100: 111.3
Daily SMA200: 111.43
Levels:
Previous Daily High: 111.83
Previous Daily Low: 111.13
Previous Weekly High: 112.14
Previous Weekly Low: 110.78
Previous Monthly High: 111.5
Previous Monthly Low: 108.73
Daily Fibonacci 38.2%: 111.57
Daily Fibonacci 61.8%: 111.4
Daily Pivot Point S1: 111.28
Daily Pivot Point S2: 110.86
Daily Pivot Point S3: 110.58
Daily Pivot Point R1: 111.98
Daily Pivot Point R2: 112.26
Daily Pivot Point R3: 112.68
