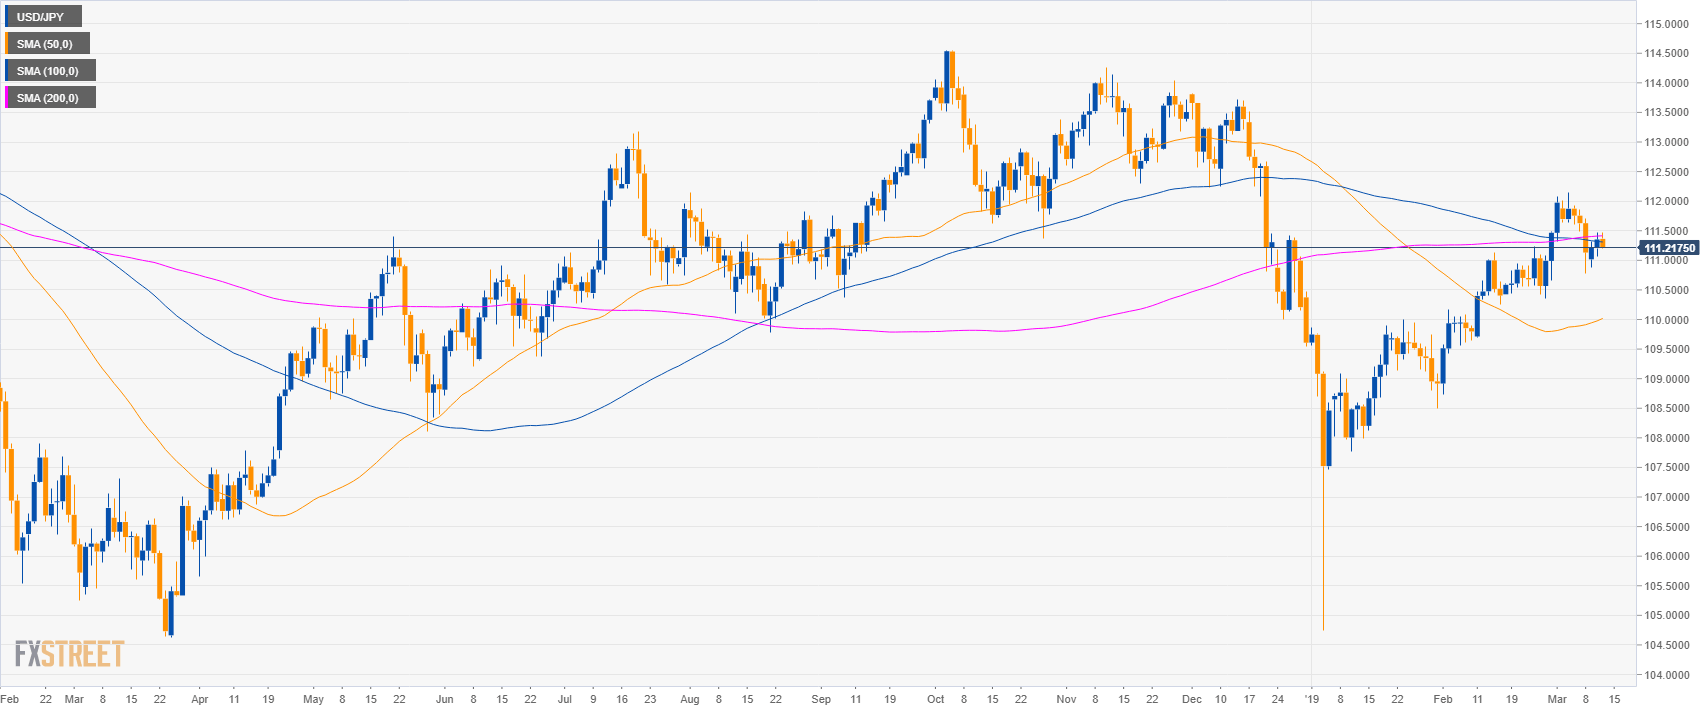
USD/JPY daily chart
- USD/JPY is trading below the 100 and 200-day simple moving averages (SMAs) suggesting a bearish bias.
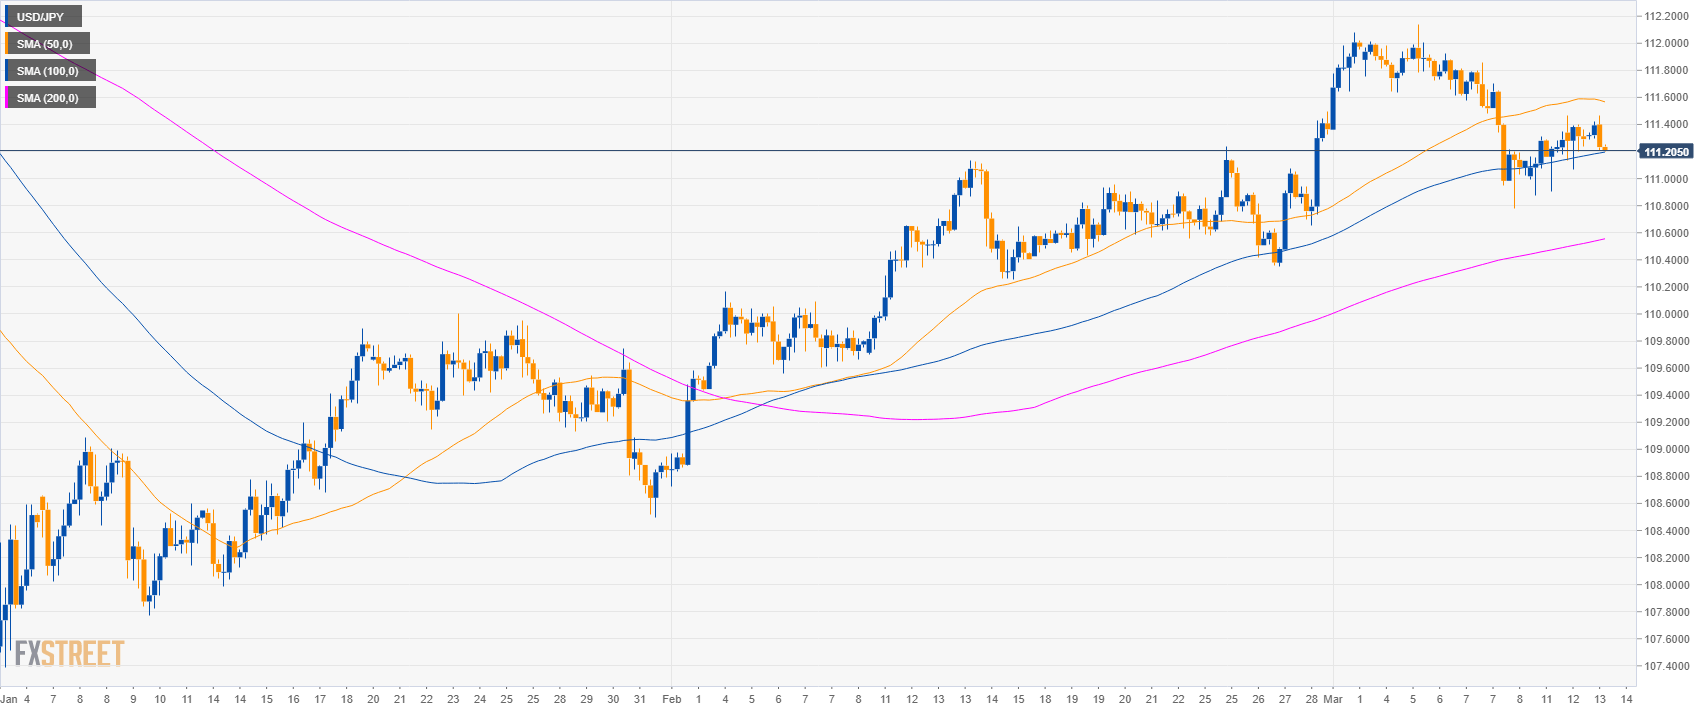
USD/JPY 4-hour chart
- USD/JPY is trading above the 100 and 200 SMAs suggesting bullish momentum in the medium-term.
USD/JPY 30-minute chart
- USD/JPY is trading below its main SMAs suggesting a bearish momentum in the short-term.
- Bears want to target 111.00 level. A break below the level can lead to 110.90 support.
- Resistances are at 111.30 and 111.50 level.
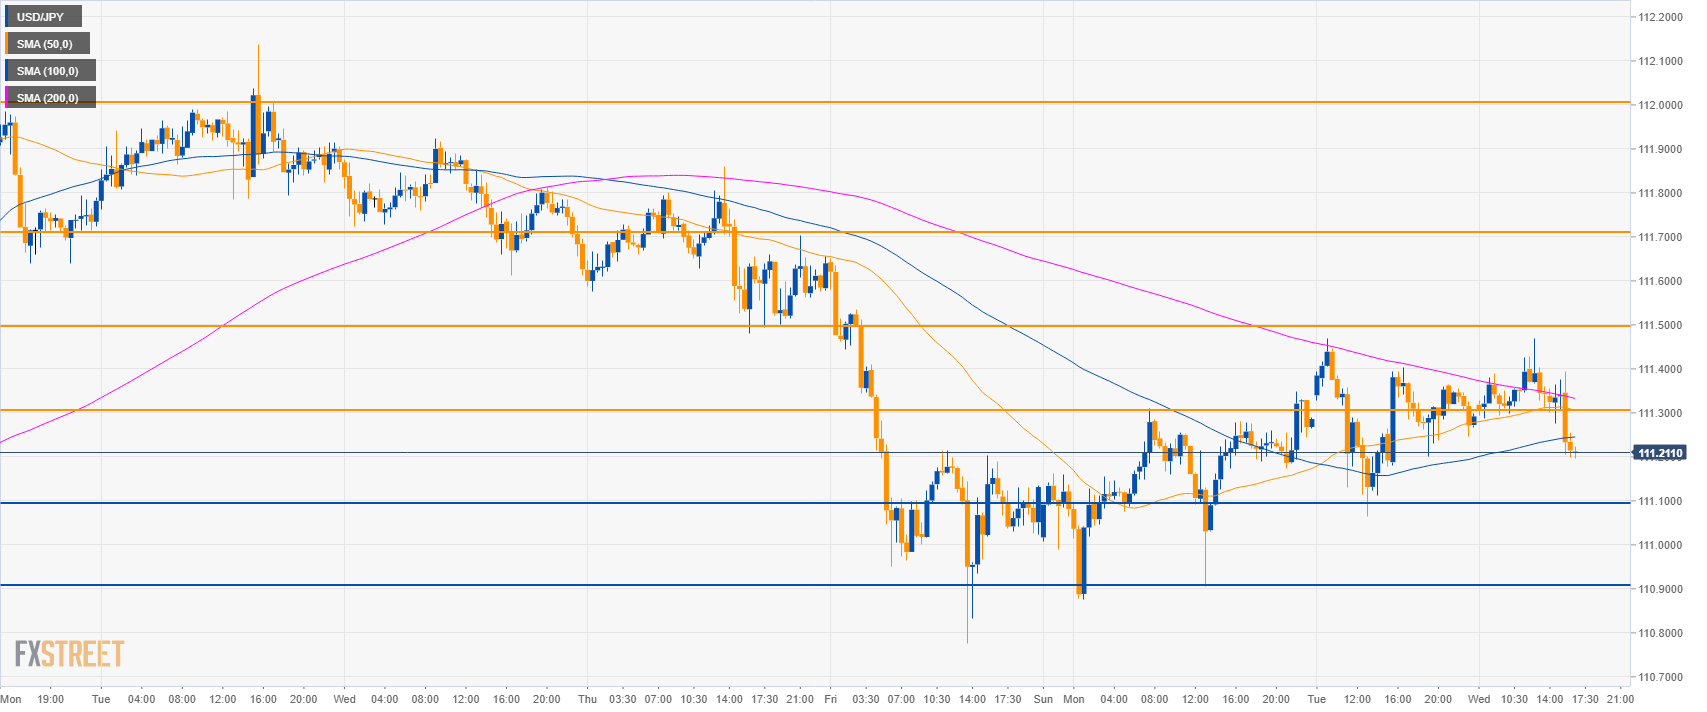
Additional key levels
USD/JPY
Overview:
Today Last Price: 111.21
Today Daily change: -14 pips
Today Daily change %: -0.13%
Today Daily Open: 111.35
Trends:
Daily SMA20: 111.1
Daily SMA50: 109.98
Daily SMA100: 111.32
Daily SMA200: 111.41
Levels:
Previous Daily High: 111.47
Previous Daily Low: 111.06
Previous Weekly High: 112.14
Previous Weekly Low: 110.78
Previous Monthly High: 111.5
Previous Monthly Low: 108.73
Daily Fibonacci 38.2%: 111.31
Daily Fibonacci 61.8%: 111.22
Daily Pivot Point S1: 111.12
Daily Pivot Point S2: 110.89
Daily Pivot Point S3: 110.72
Daily Pivot Point R1: 111.53
Daily Pivot Point R2: 111.7
Daily Pivot Point R3: 111.93
