- USD/JPY starts the week in a tight range near the 107.00 handle.
- The level to beat for bulls is the 107.00 figure followed by the 107.40 resistance.
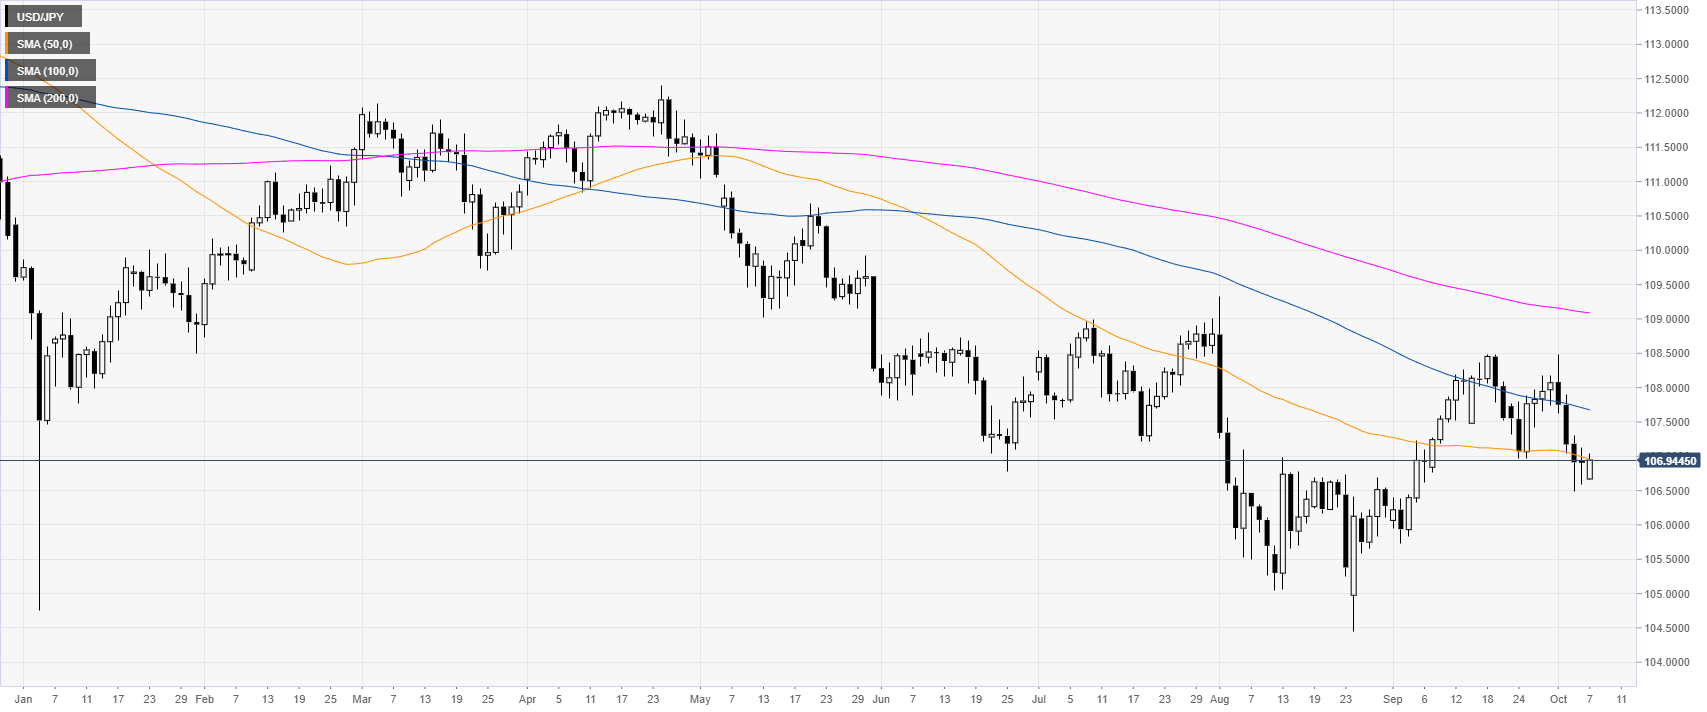
USD/JPY daily chart
USD/JPY is trading in a bear trend below the main simple moving averages (SMAs). The market is challenging the 50 SMA this Monday in the New York session.
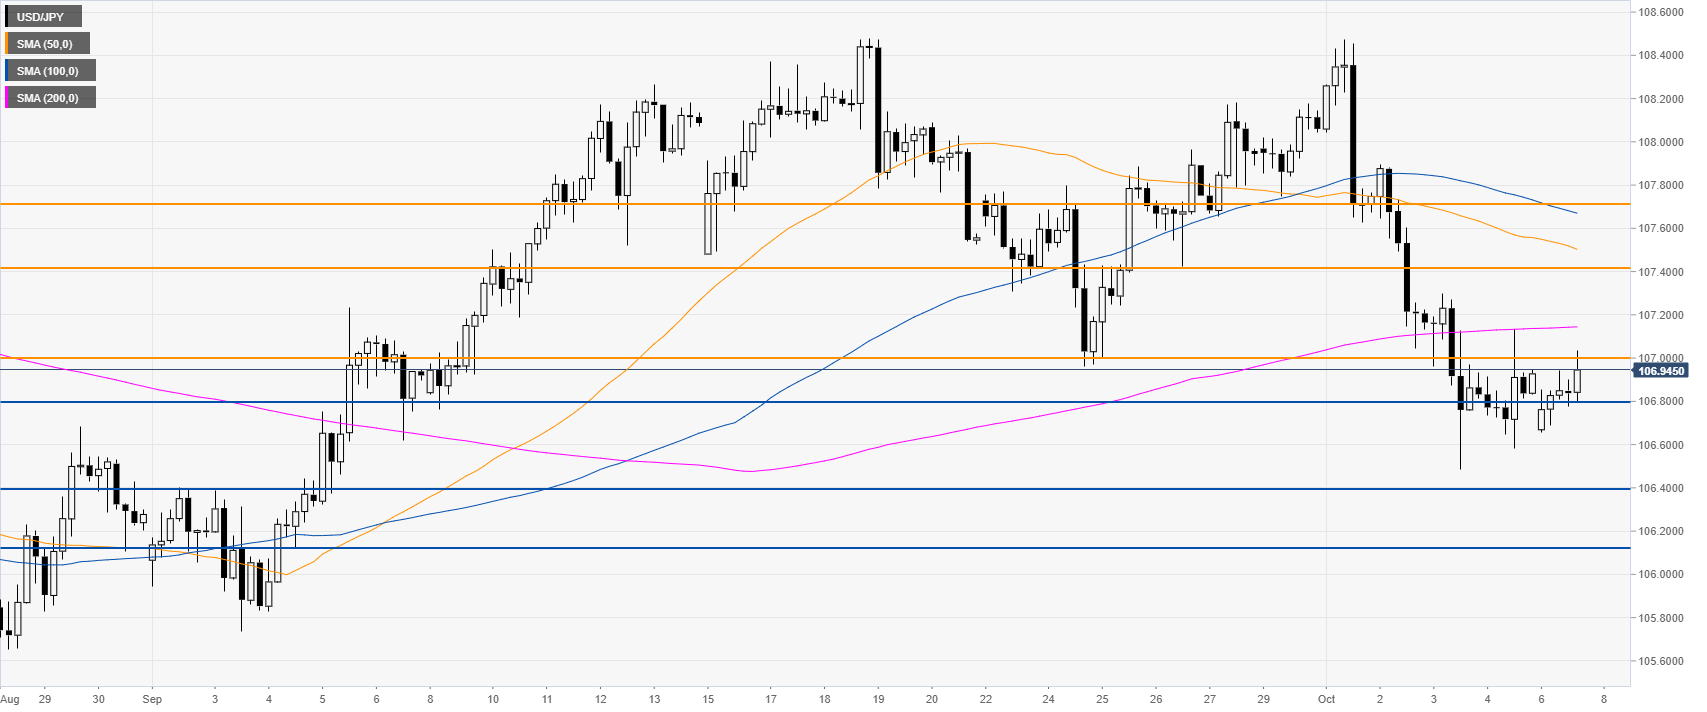
USD/JPY four-hour chart
USD/JPY is under pressure below the 107.00 figure and main 200 SMA. A break below the 106.80 support can expose the 106.40 level to the downside, according to the Technical Confluences Indicator.
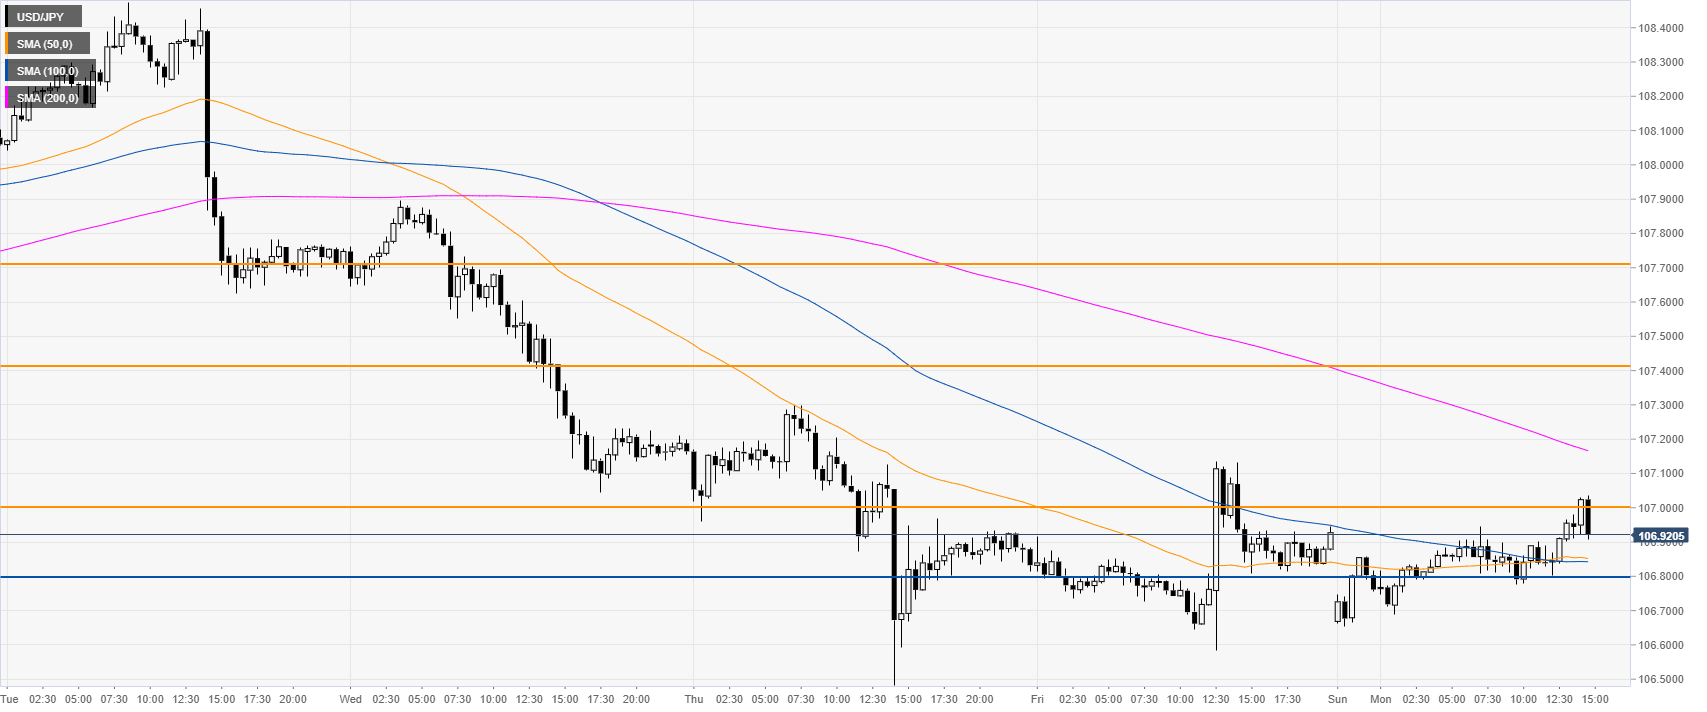
USD/JPY 30-minute chart
The USD/JPY currency pair is trading above the 50/100 SMAs, suggesting a consolidation up in the near term. Immediate resistances are seen at the 107.00 and 107.40 price levels. Further up lie the 107.70 level, according to the Technical Confluences Indicator.
Additional key levels
