- USD/JPY is trading at daily lows near 108.50 as the London session will soon come to an end.
- USD/JPY is giving back some of the gains made in the early October bull run.
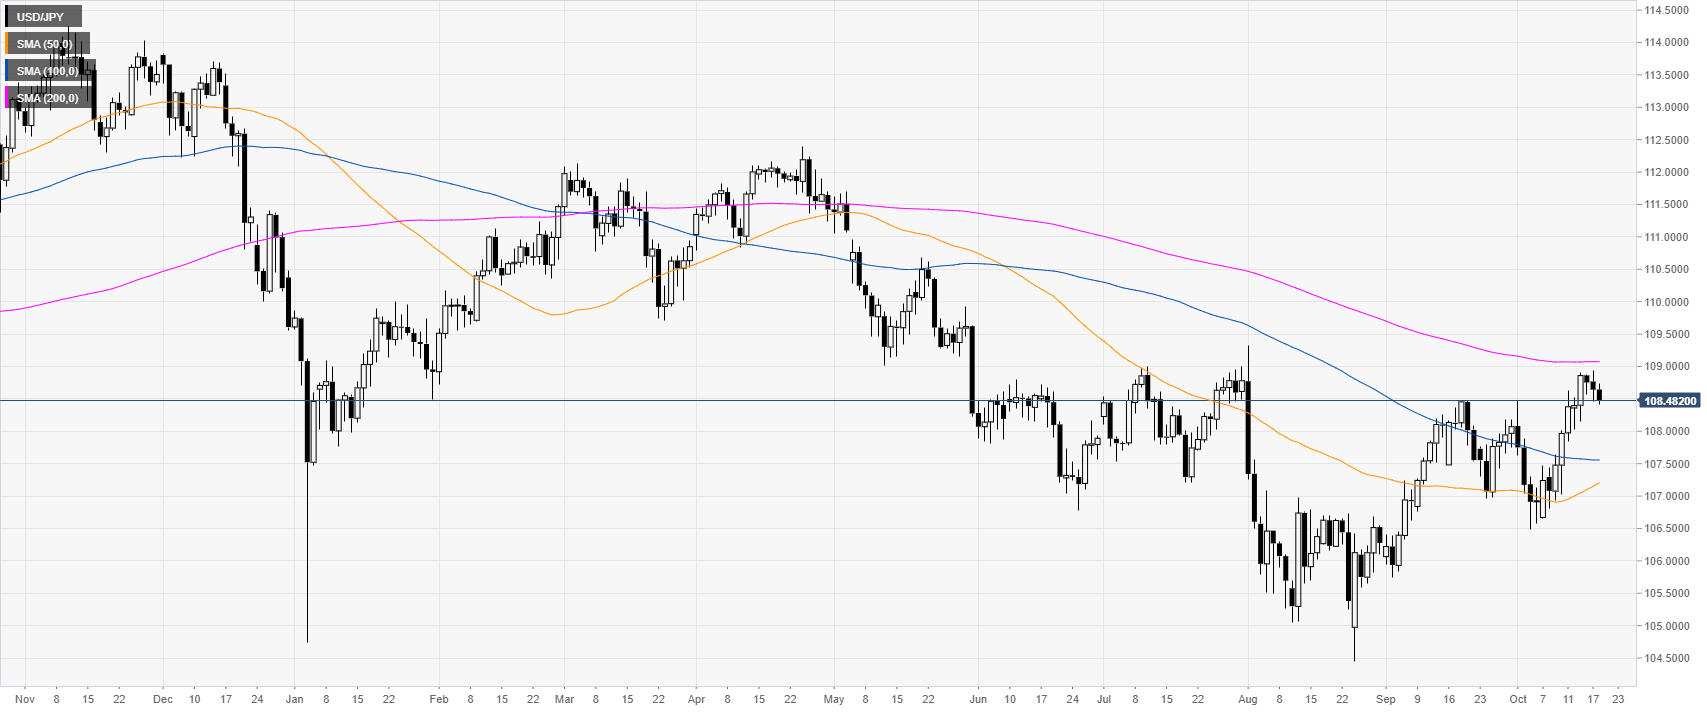
USD/JPY daily chart
The USD/JPY currency pair is trading in a bear trend below the 200-day simple moving average (DSMA). The spot is currently consolidating the October bull leg below the 109.00 handle.
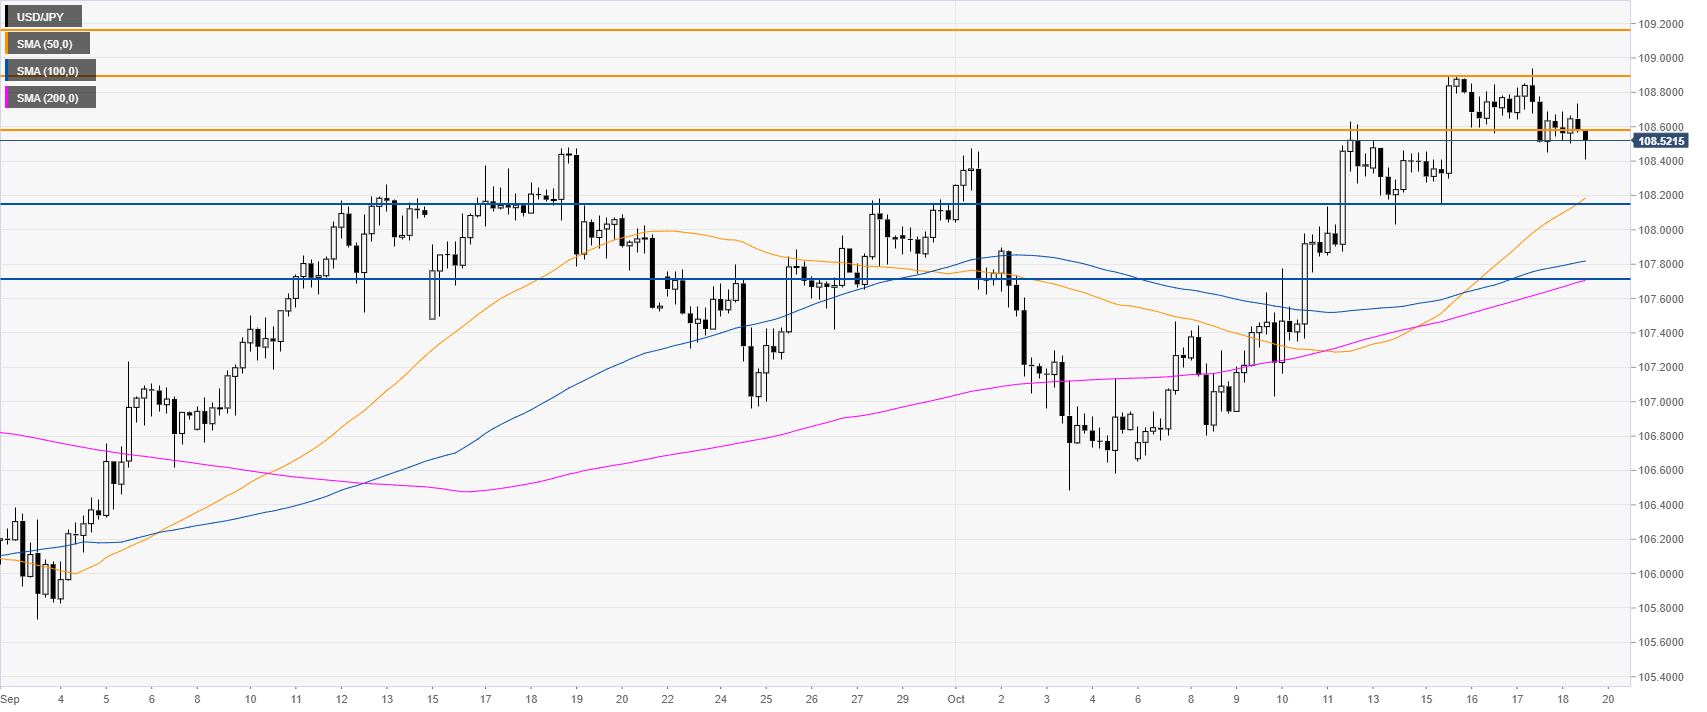
USD/JPY four-hour chart
USD/JPY is trading above the main SMAs on the four-hour chart, suggesting a bullish bias in the medium term. The level to beat for bulls is the 108.56 resistance followed by the 108.90 price level, according to the Technical Confluences Indicator.
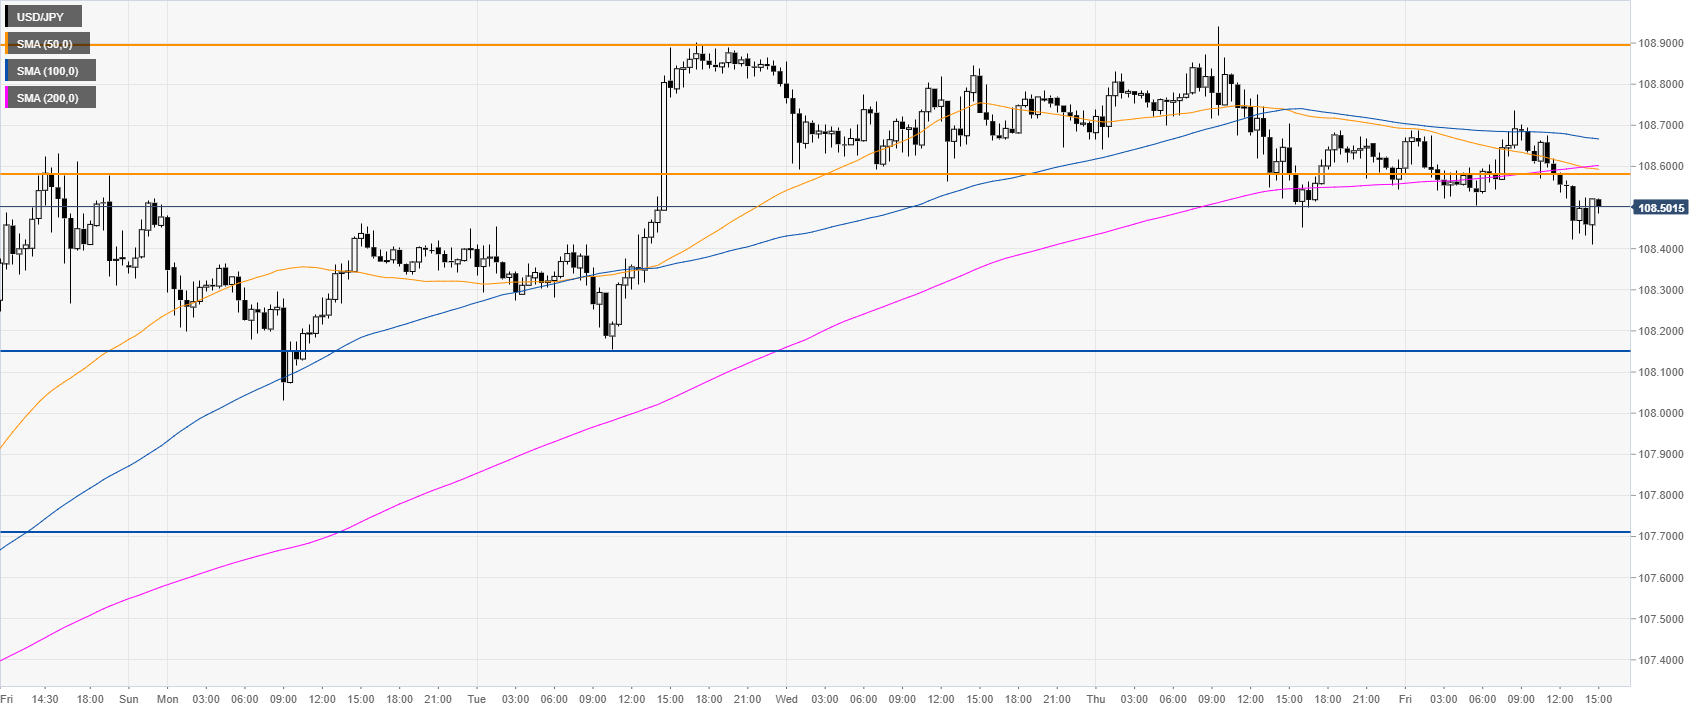
USD/JPY 30-minute chart
USD/JPY is trading below the main SMAs, suggesting bearish momentum in the near term. Bears might have taken over and the next relevant support is seen at the 108.16 and 107.70 price levels, according to the Technical Confluences Indicator.
Additional key levels
