- This week USD/JPY consolidated the October bull run.
- The level to beat for bears is the 108.16 support.
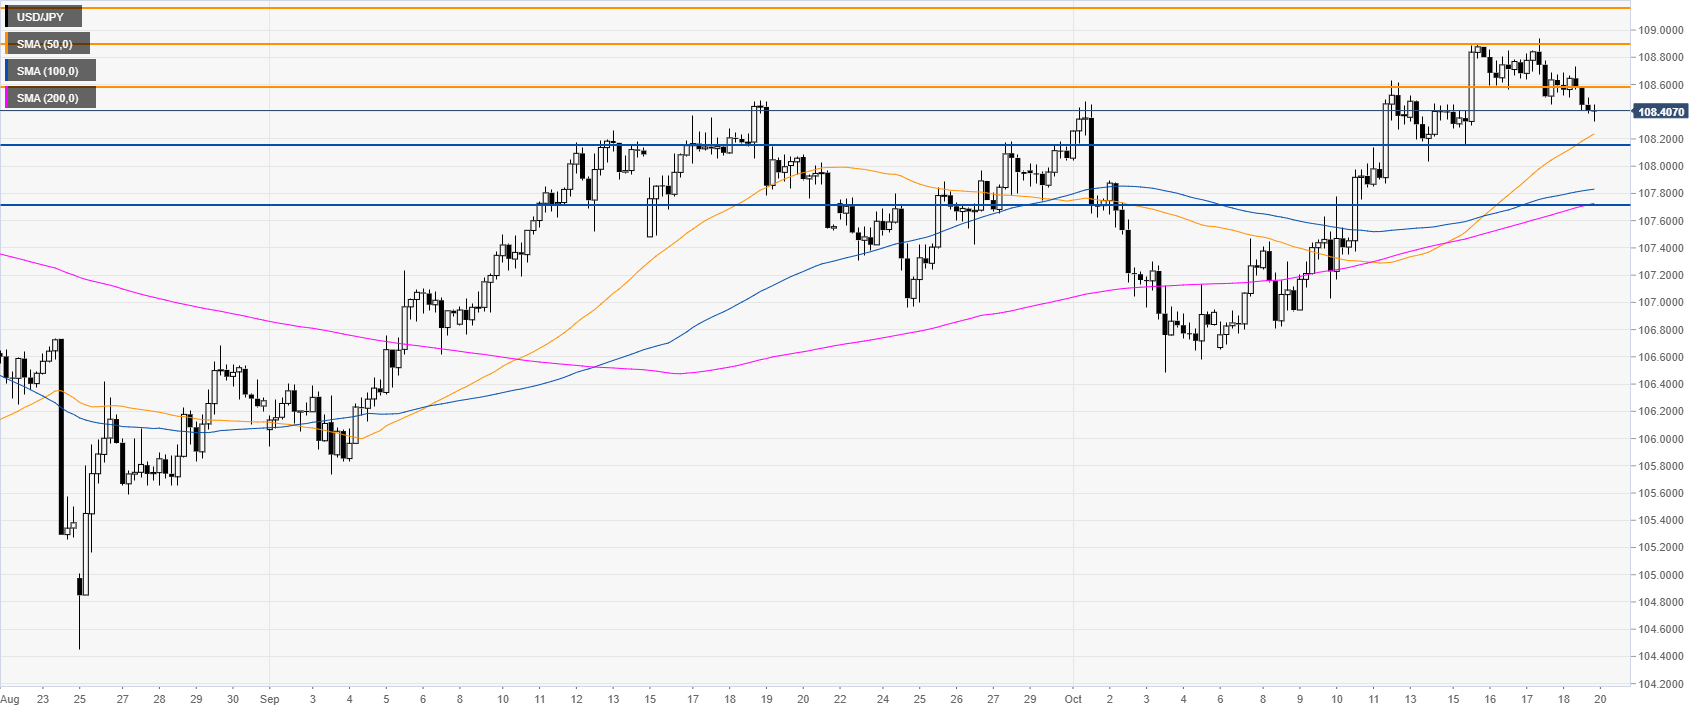
USD/JPY daily chart
USD/JPY is trading in a bear trend below its 200-day simple moving average (DSMA). The spot is currently retracing down after the October bull run.

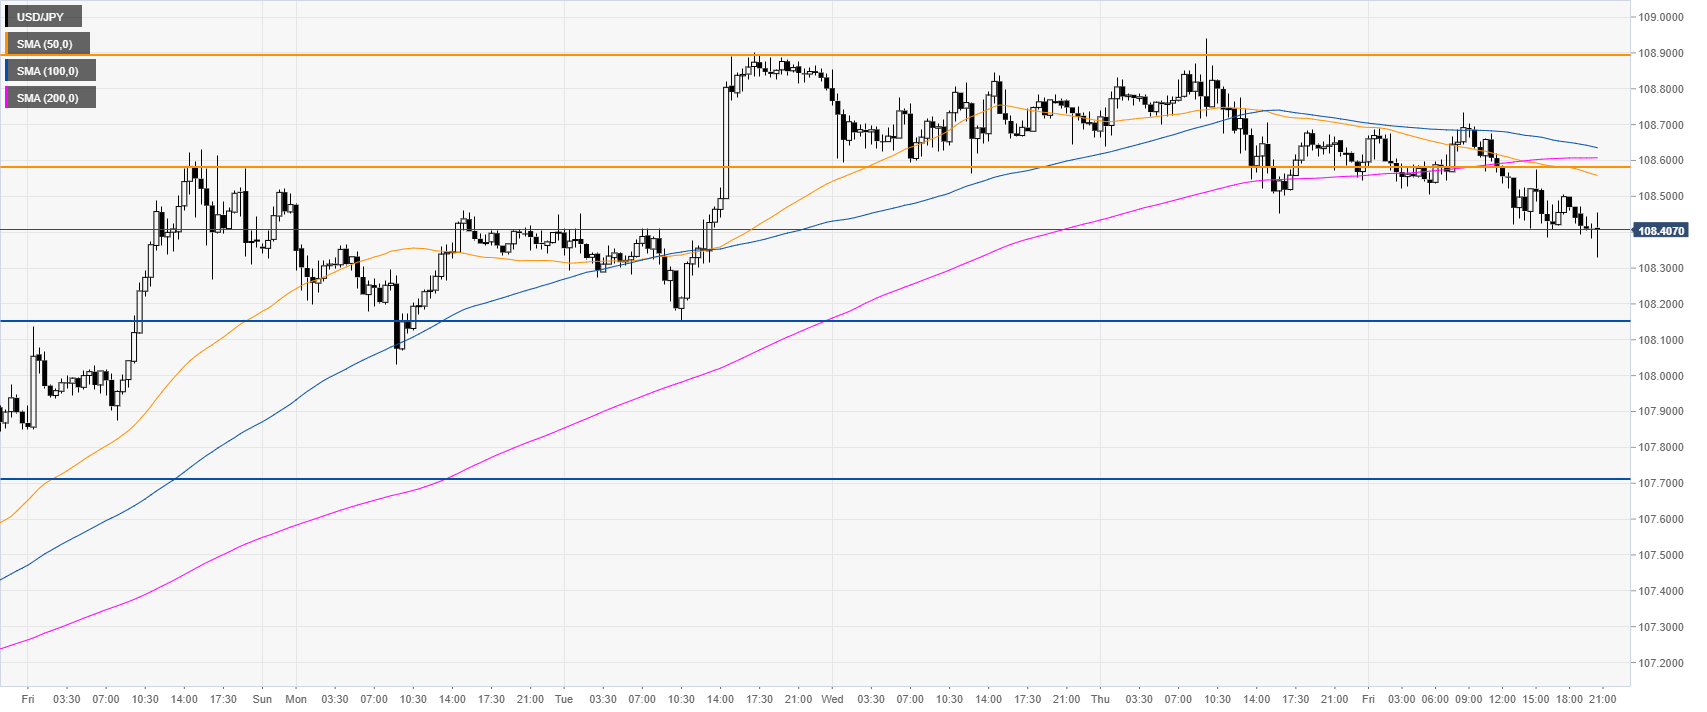
USD/JPY four-hour chart
USD/JPY is above the main SMAs on the four-hour chart, suggesting a positive momentum in the medium term. The level to beat for buyers is the 108.56 resistance followed by the 108.90 level, according to the Technical Confluences Indicator.
USD/JPY 30-minute chart
USD/JPY is trading below its primary SMAs, suggesting a bearish bias in the near term. Next week, the sellers might target the support levels at 108.16 and 107.70, according to the Technical Confluences Indicator.
Additional key levels
