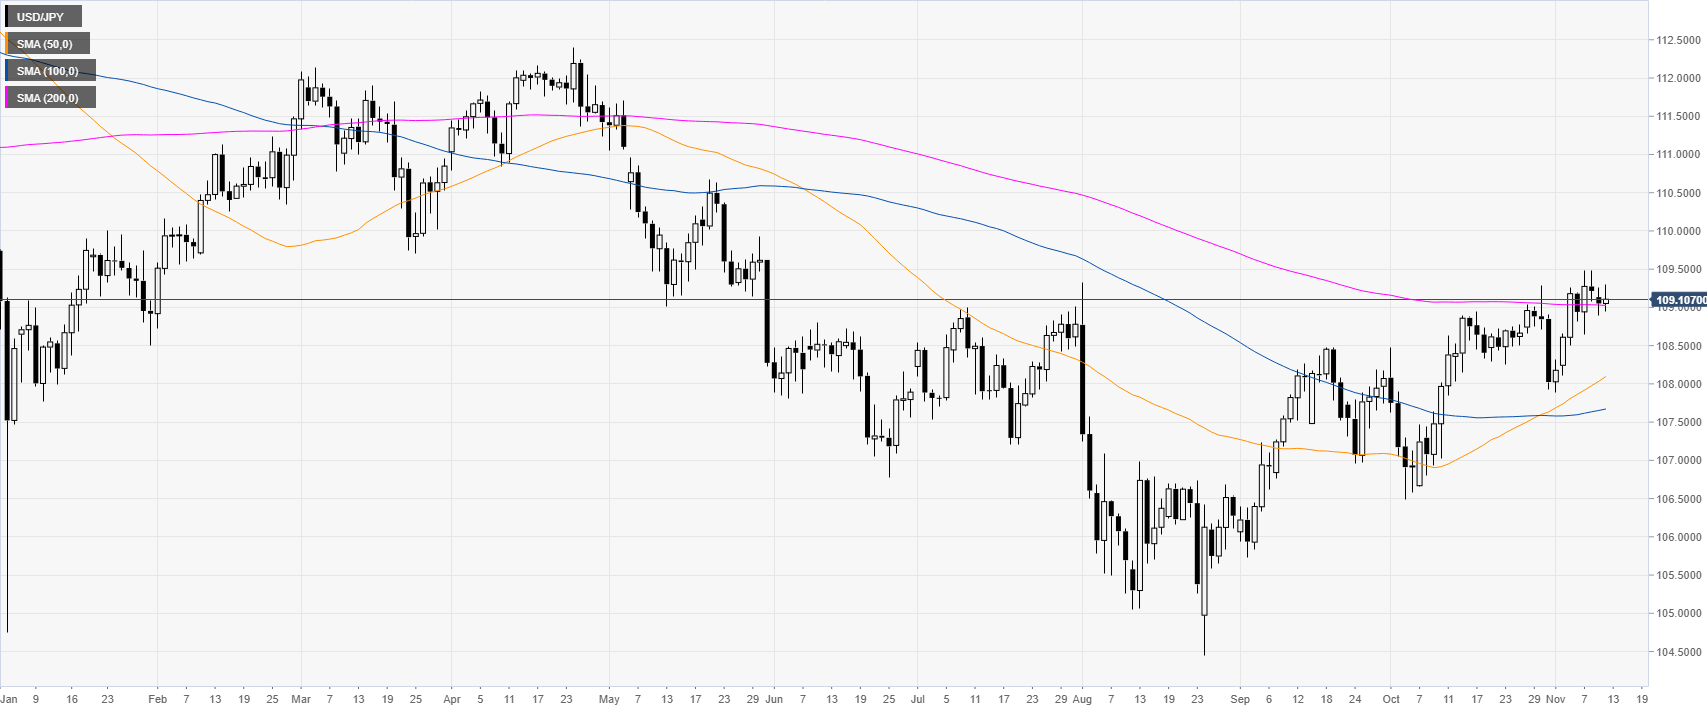
- USD/JPY is looking for a clear direction while trading near the 109.00 figure and 200 DMA.
- Support is seen at the 109.03 and 108.75 price levels.
USD/JPY daily chart
USD/JPY is trading just above the 109.00 handle and the 200-day simple moving average (DMA) on the daily time frame. In September and November, the spot has been gaining considerable strength.

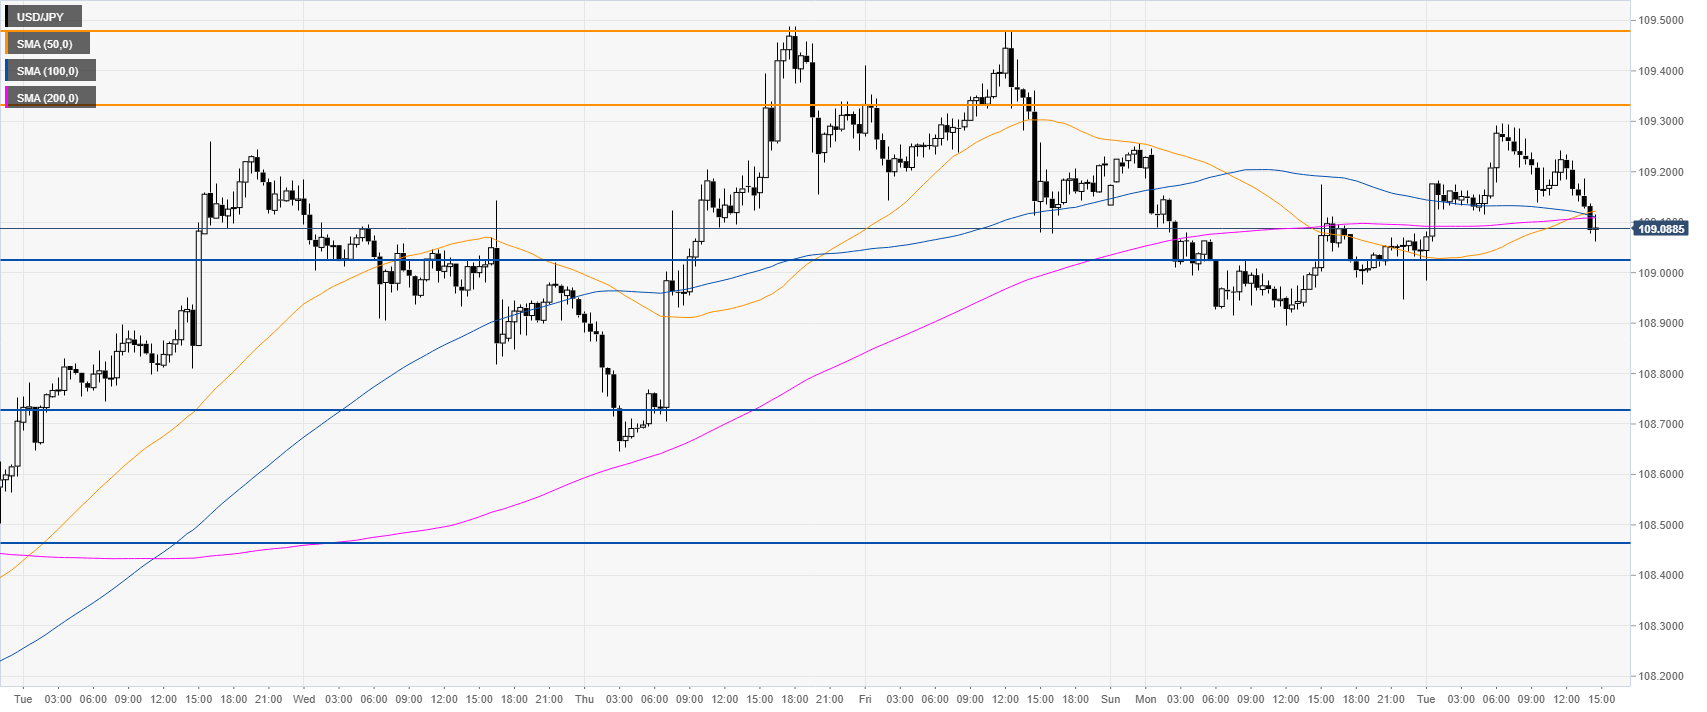
USD/JPY four-hour chart
Dollar/Yen is trading above its main SMAs on the four-hour chart, suggesting a bullish momentum in the medium term. The market is battling for the 109.00 handle. A daily break above the 109.32/49 price zone can lead to an acceleration towards the 109.77 and 110.34 price levels, according to the Technical Confluences Indicator.
USD/JPY 30-minute chart
USD/JPY is reversing its previous intraday gains as the market is nearing the 109.03 support. Further down lie the 108.75, 108.47 and 107.93 levels, according to the Technical Confluences Indicator. The outlook in the near term seem to be neutral to bearish.
Additional key levels
