- USD/JPY is trading down as risk-off is favoring the yen.
- Support is seen at the 108.41 and 107.96 price levels.
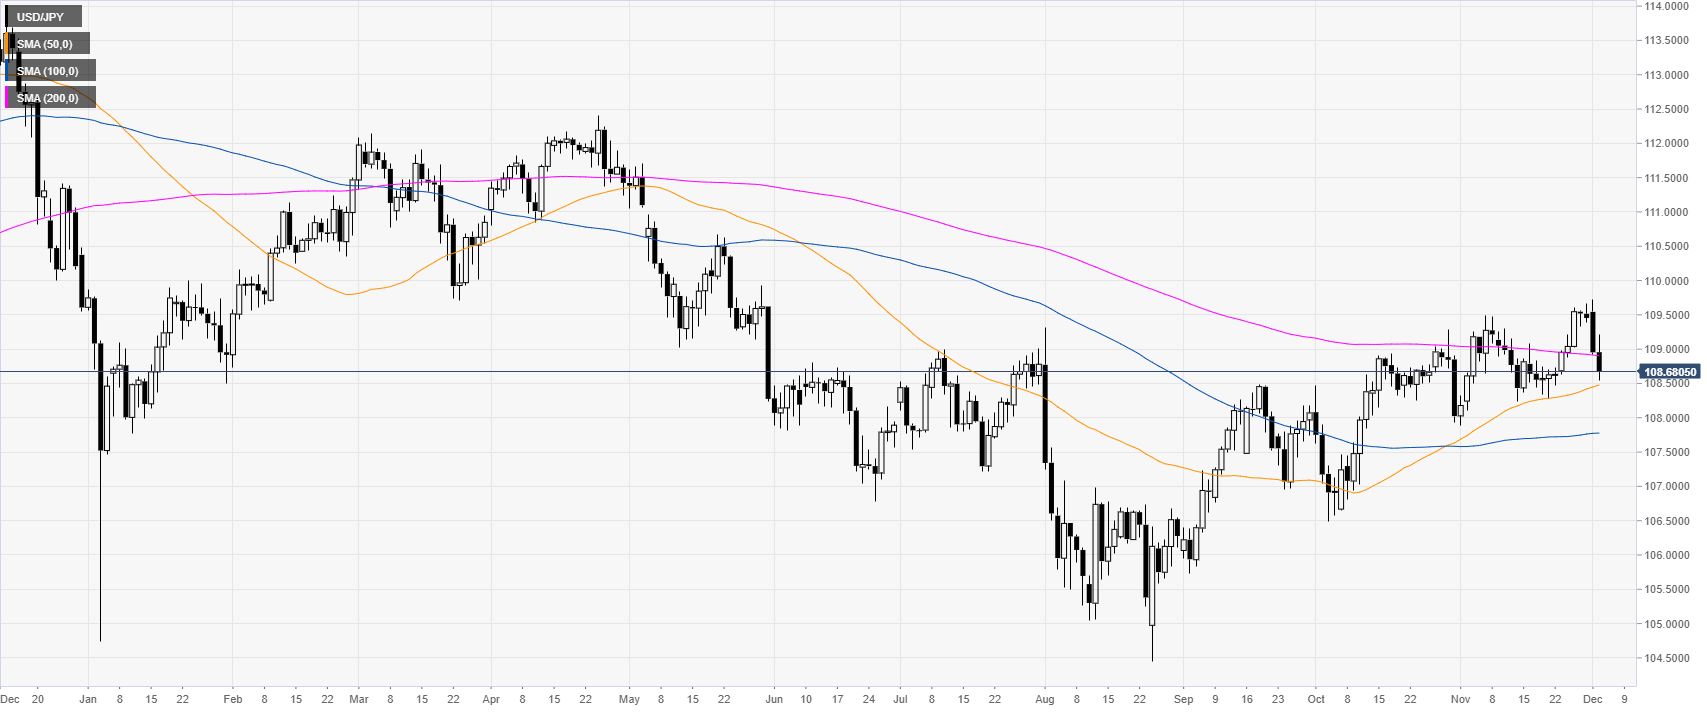
USD/JPY daily chart
USD/JPY is easing from the November highs while trading below the 109.00 handle and the 200-day simple moving average (DMA) on the daily chart. Risk-off is hurting the greenback and favoring the Japanese yen.
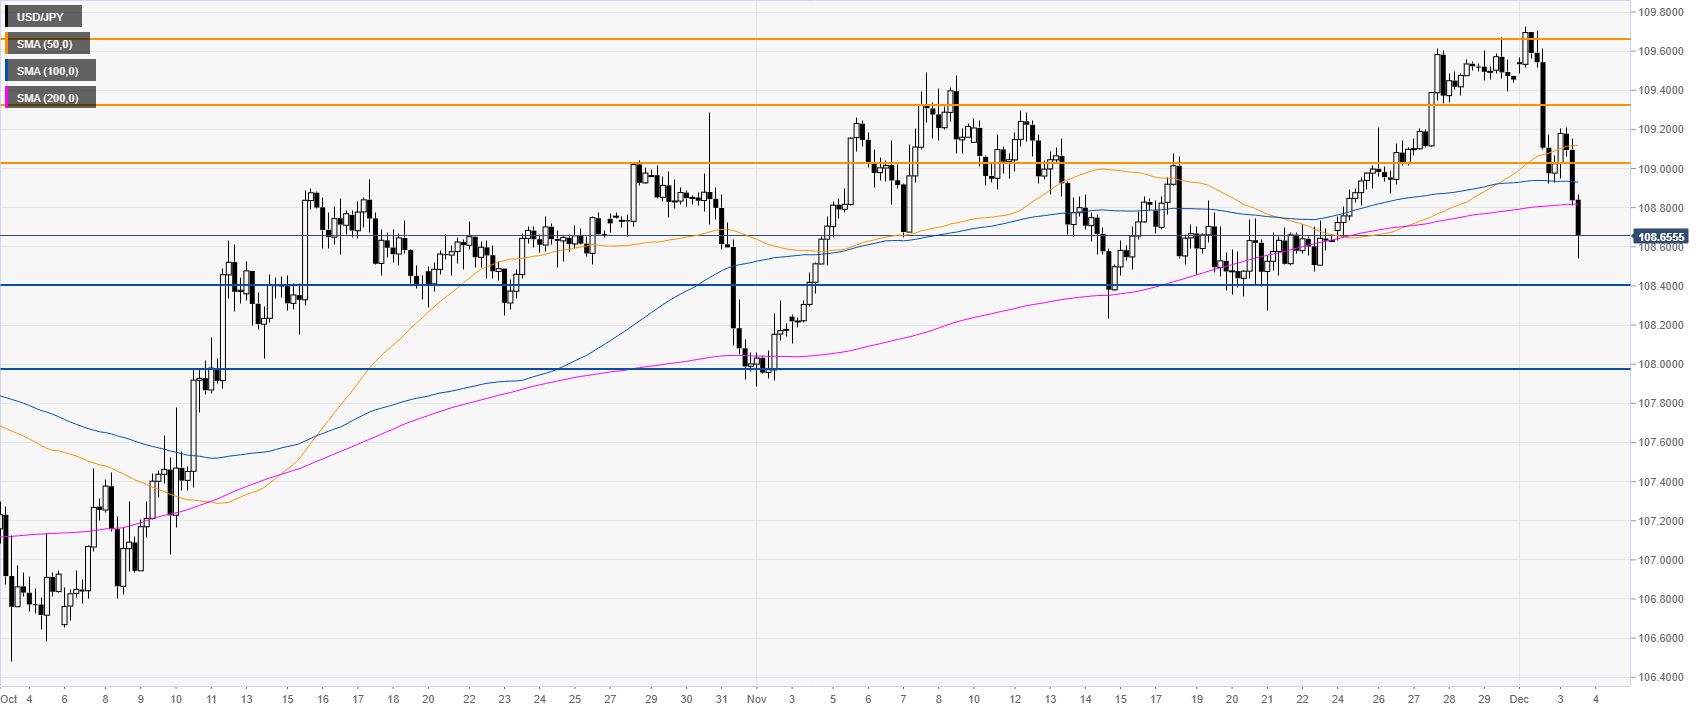
USD/JPY four-hour chart
USD/JPY had a sharp move down below the 109.00 figure and its main SMAs. As the market is weakening, the spot could continue to drift down towards 108.41 and 107.96 price levels, according to the Technical Confluences Indicator.
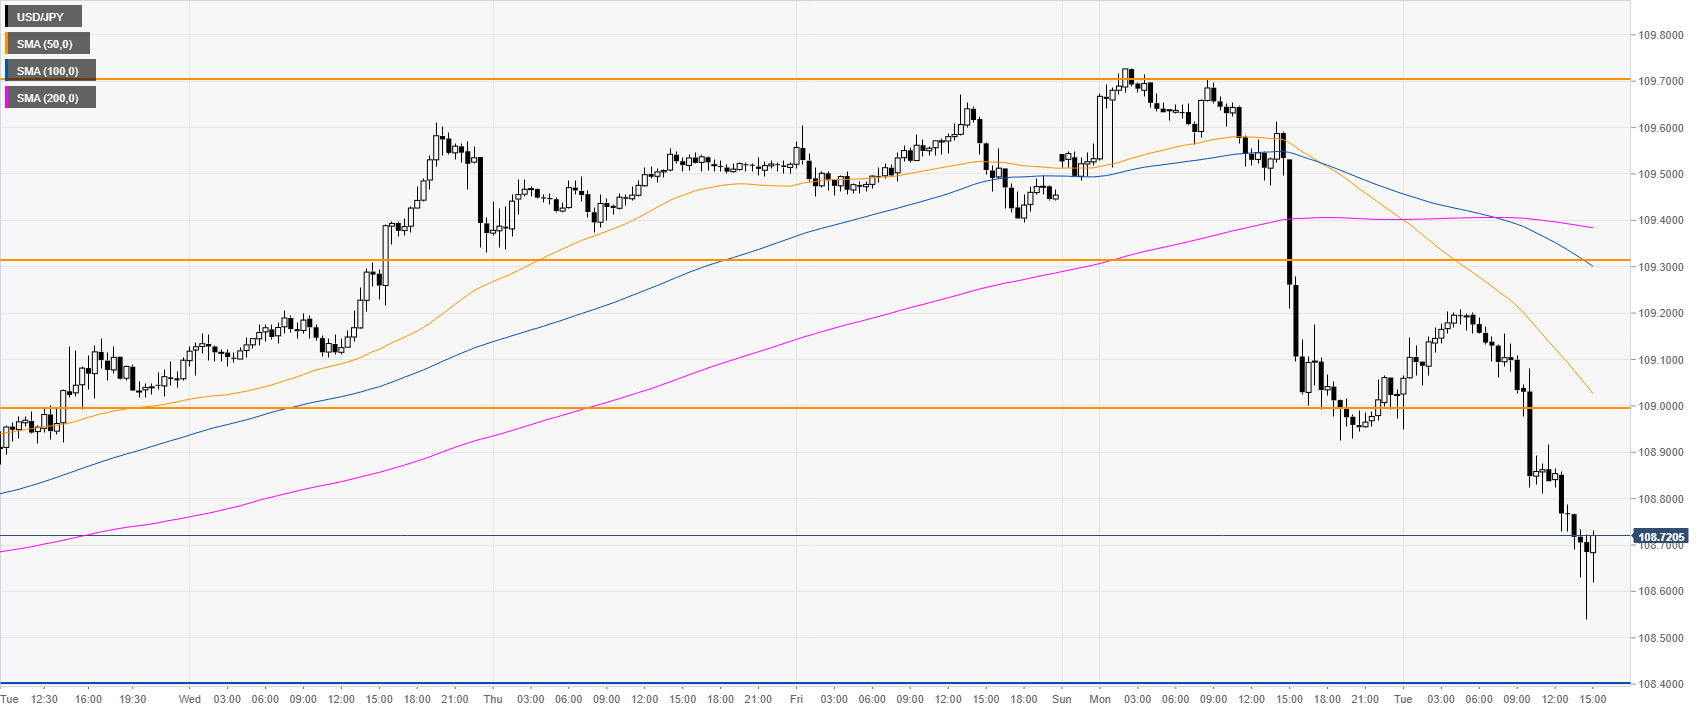
USD/JPY 30-minute chart
USD/JPY is trading below the main SMAs on the 30-minute chart suggesting a bearish momentum in the near term. Resistance is seen at 109.00, 109.31 and the 109.70 price levels, according to the Technical Confluences Indicator.
Additional key levels
