- USD/JPY is bouncing from the monthly lows as buyers broke above the 108.00 figure.
- The levels to beat for bulls are seen at 108.27 and the 108.41 resistances.
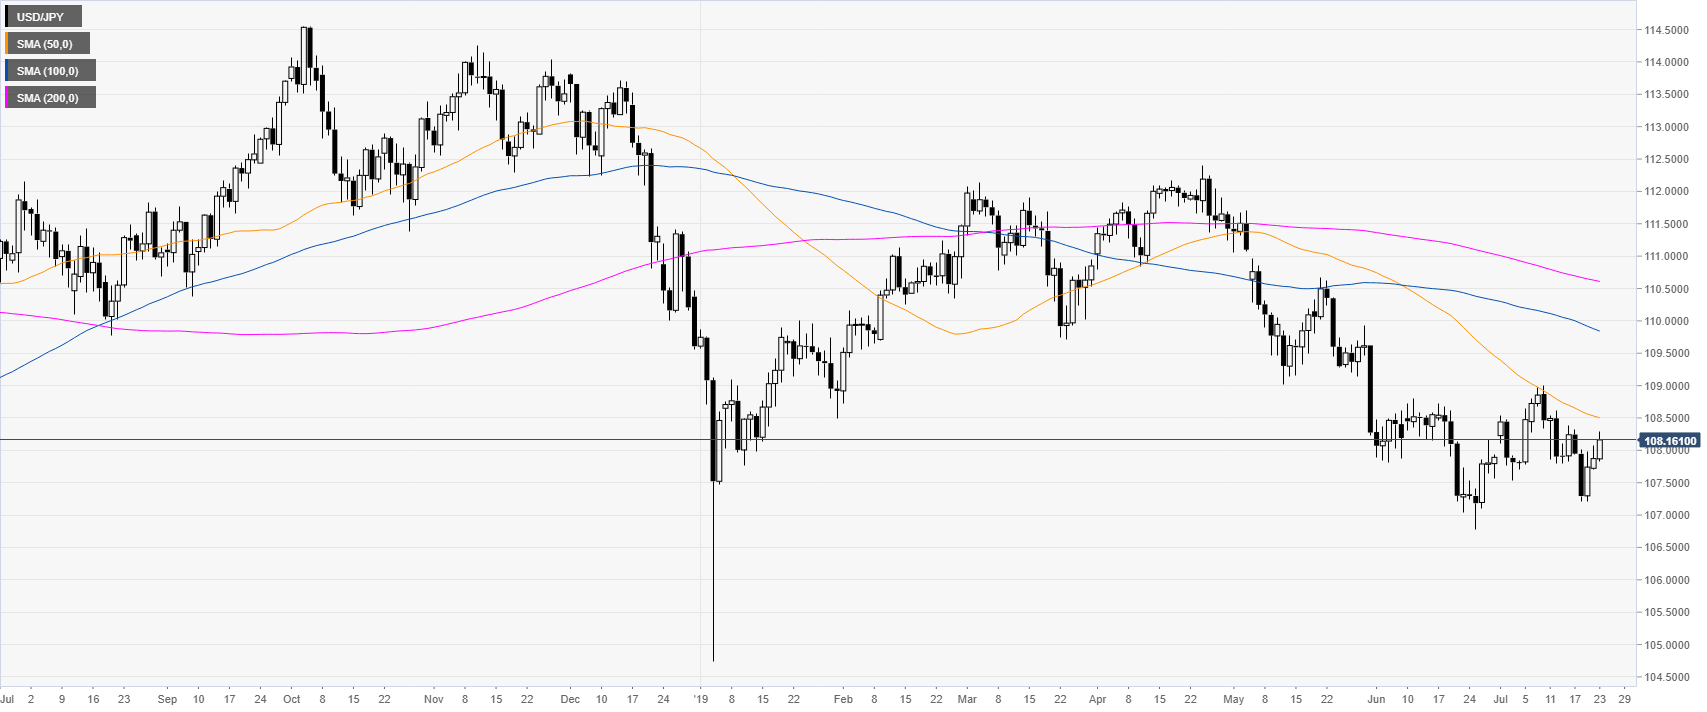
USD/JPY daily chart
USD/JPY is up for the third consecutive day but still trading below the main daily simple moving averages (DSMAs). Spot is trading above the 108.00 figure.

USD/JPY 4-hour chart
USD/JPY is attempting to break above 108.27 resistance zone and its main SMAs. A break above the level can lead to 108.41 and 108.86 resistances. 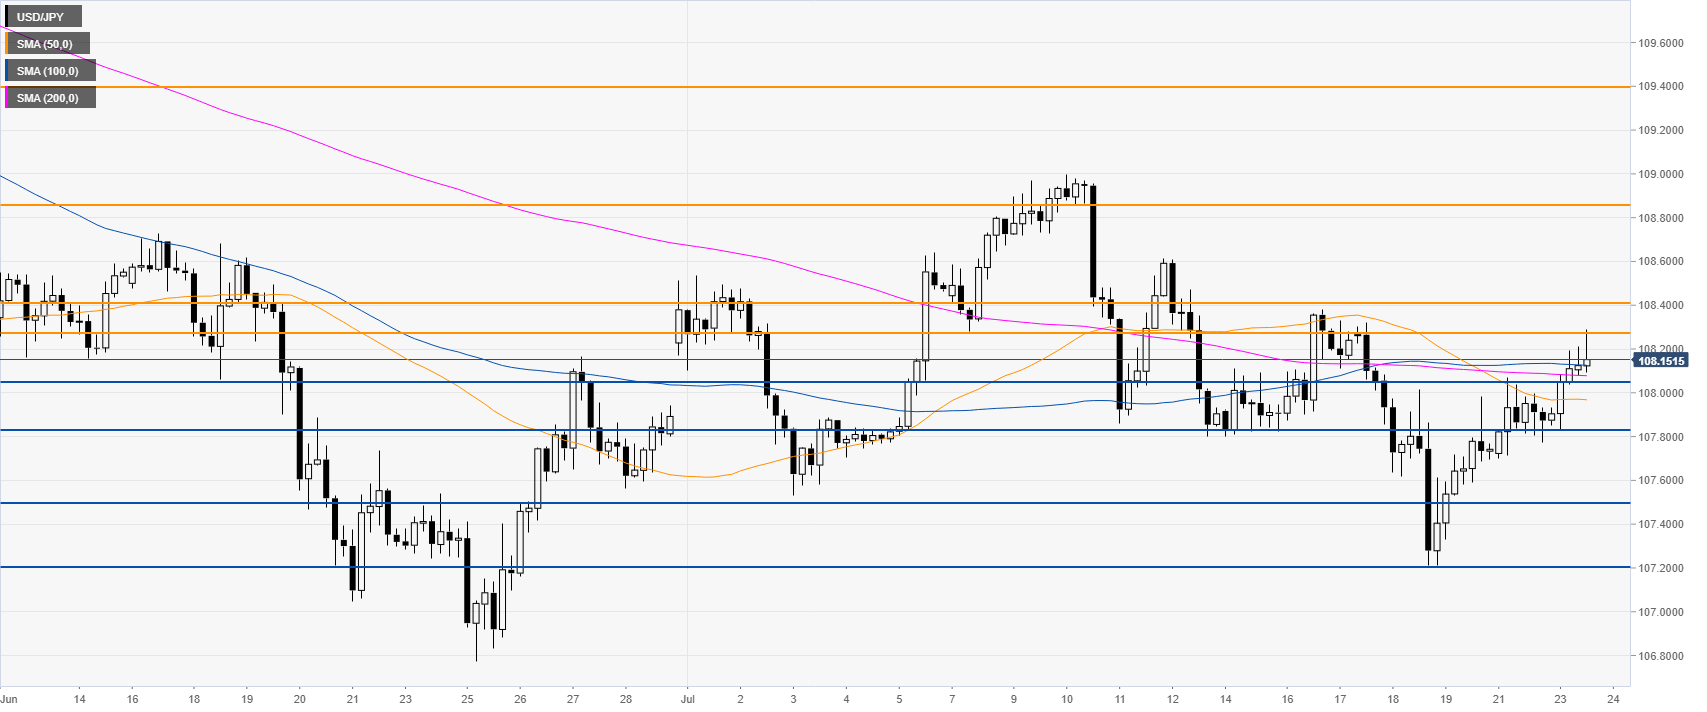
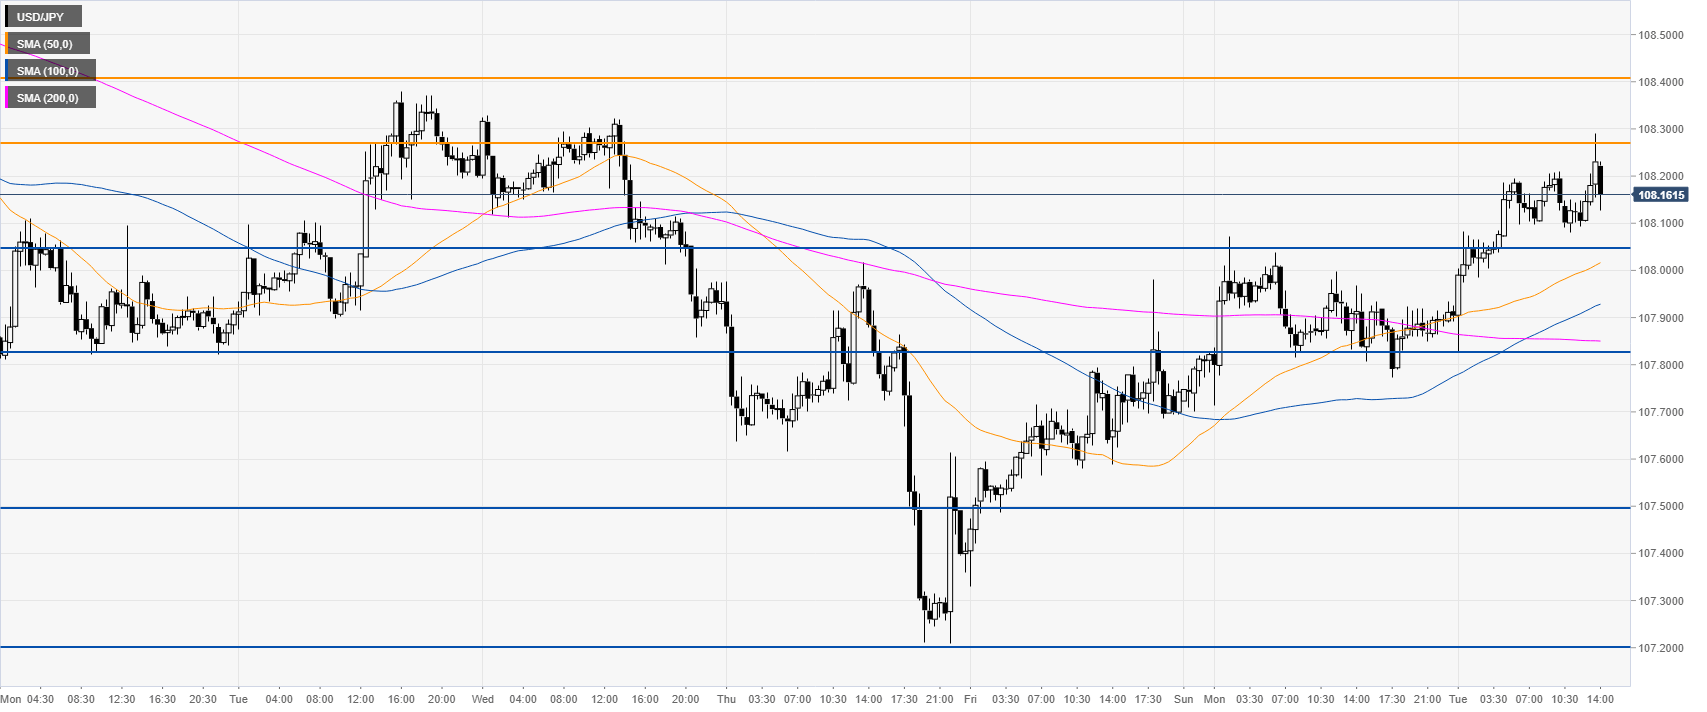
USD/JPY 30-minute chart
USD/JPY is trading above its main SMAs suggesting bullish momentum in the near term. Immediate support is seen at the 108.03 and 107.83 levels.
Additional key levels
