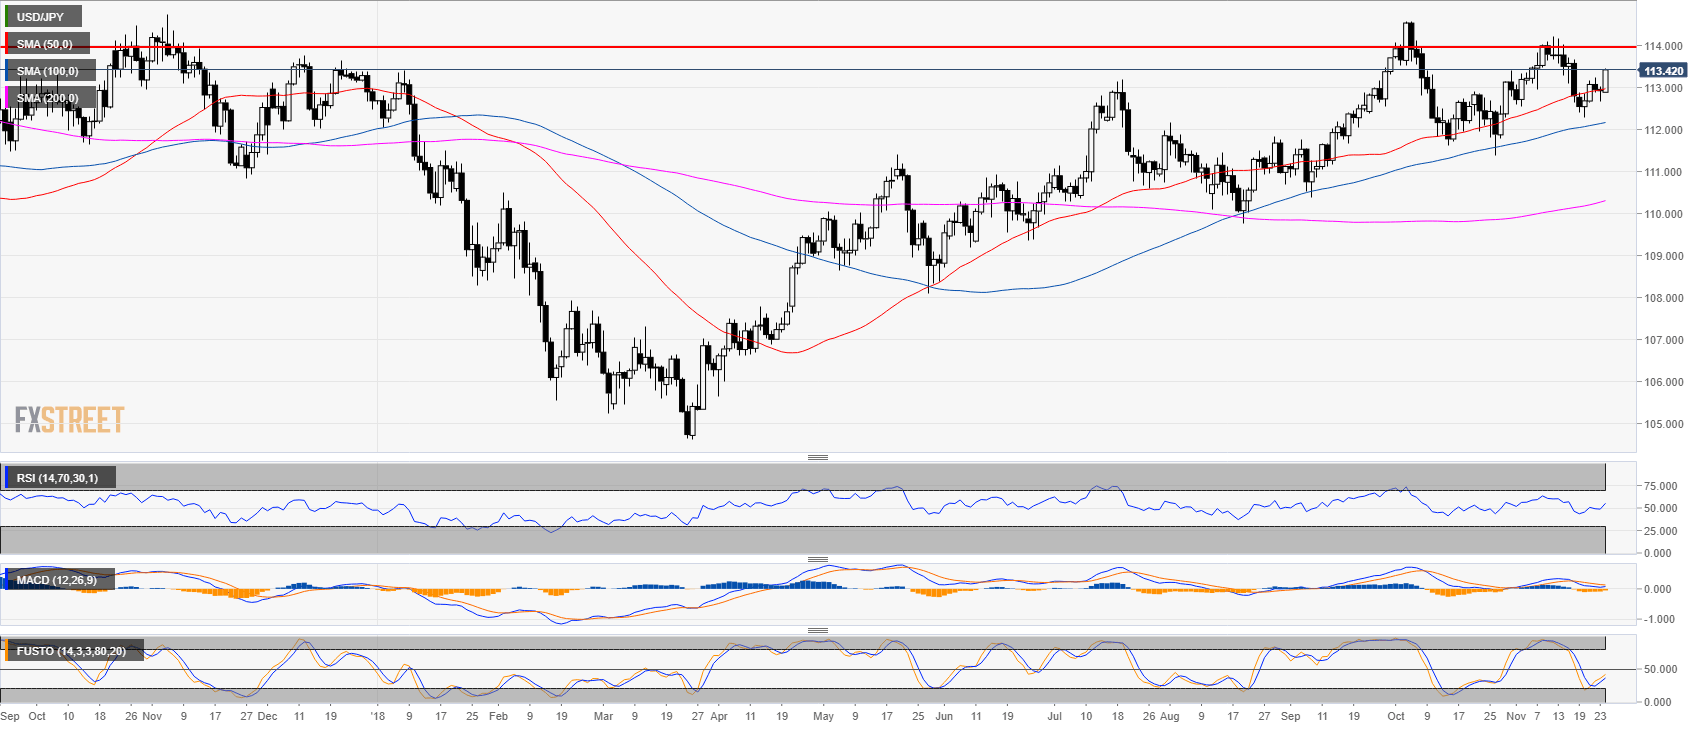
USD/JPY daily chart:
- USD/JPY is trading in a bull trend above its main simple moving averages (SMAs).
- USD/JPY bulls objective is to reclaim the 114.00 figure.
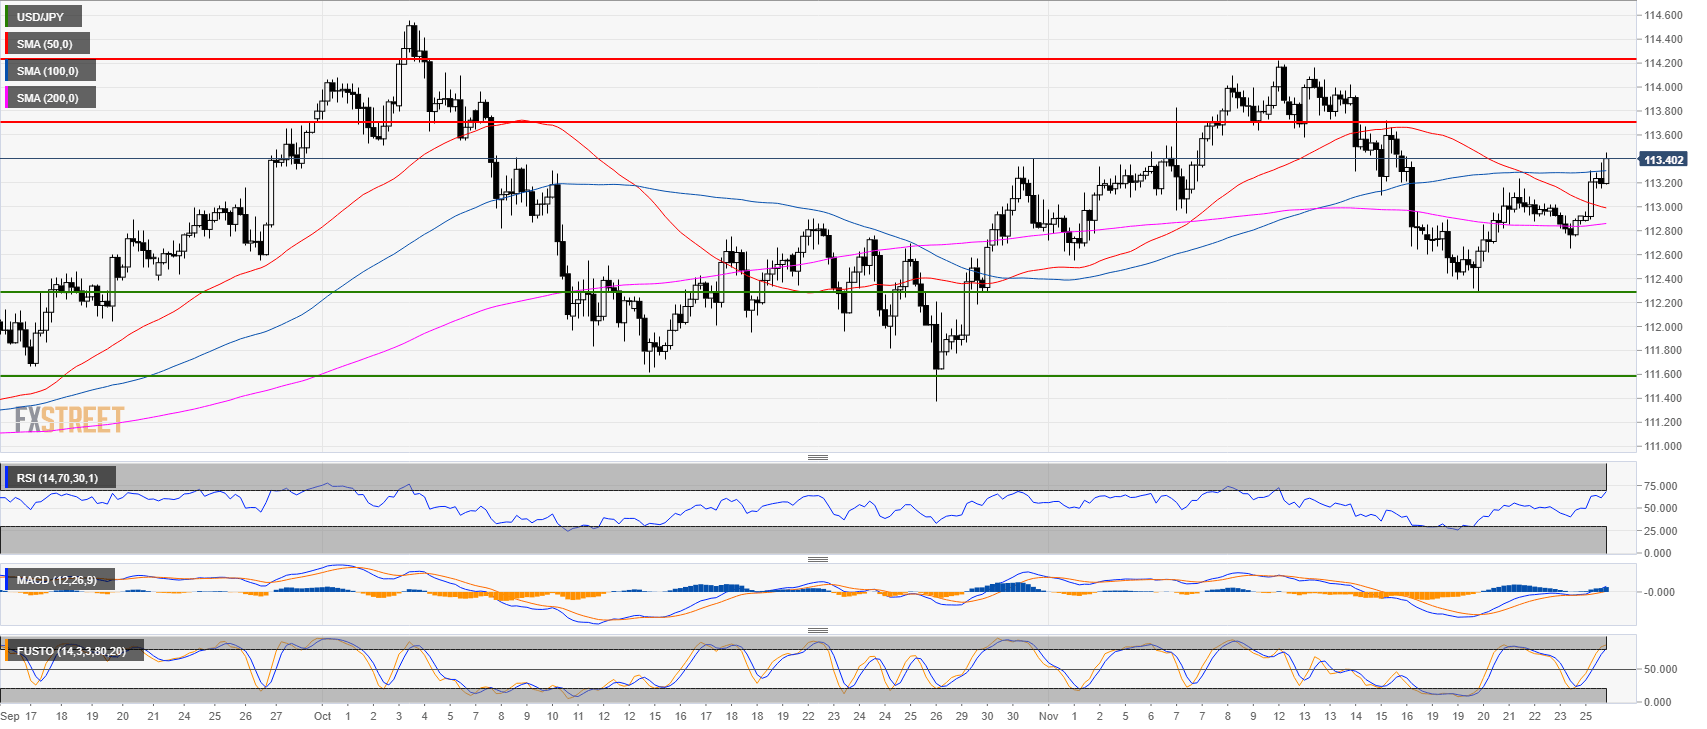
USD/JPY 4-hour chart
- USD/JPY broke above 113.20 and the last swing high as the market is trading above its main SMAs.
- The RSI and the Stochastic are in positive territories while the MACD is bullish.
- The main resistance to the upside is at the 113.70 level while main support is at 112.30.
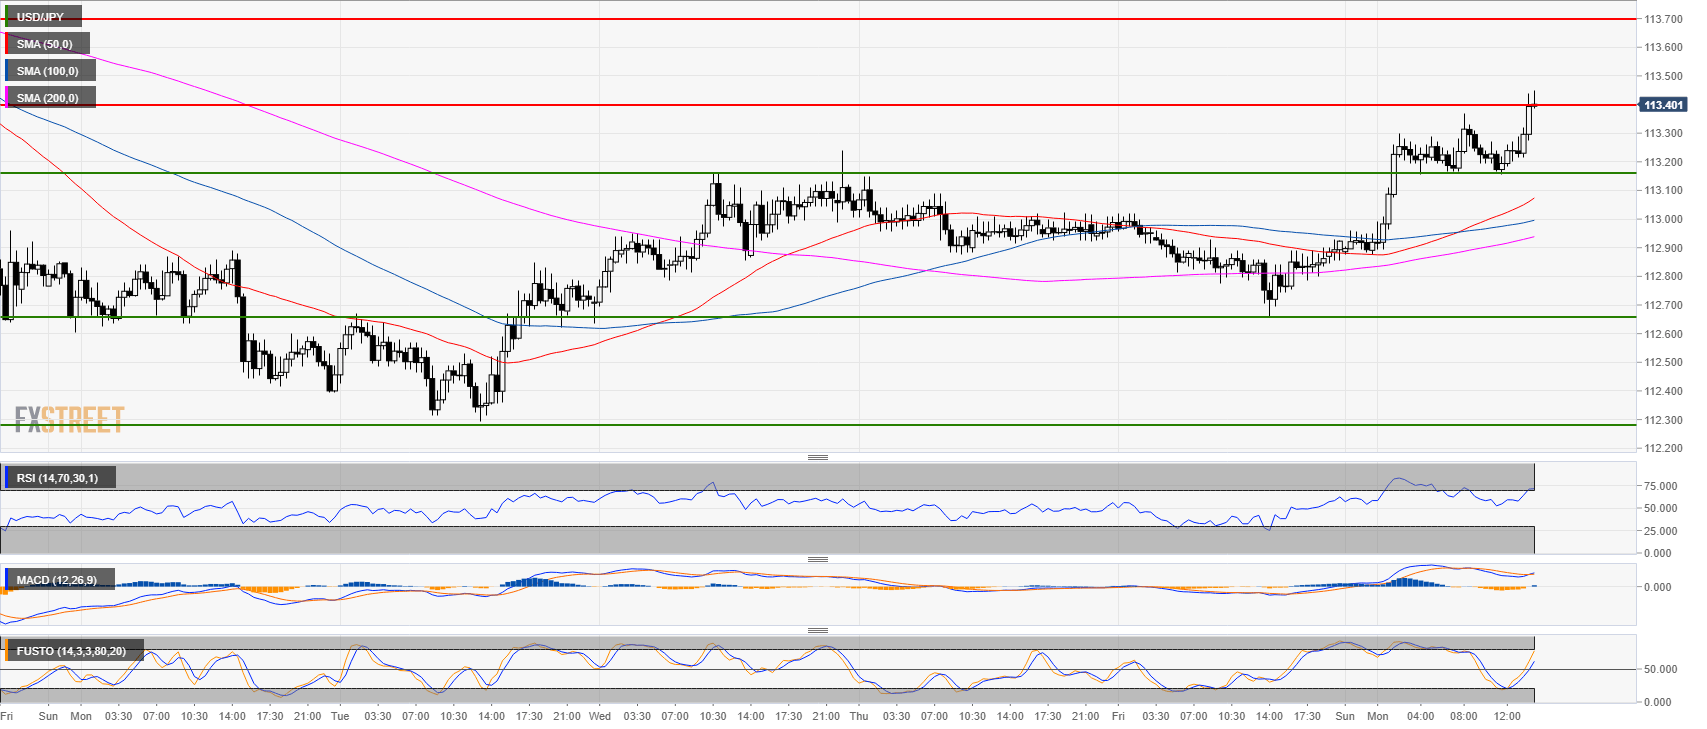
USD/JPY 30-minute chart
- USD/JPY is facing some short-term resistance at 113.40 as the market is trading above its main SMAs.
- USD/JPY is at the daily high while technical indicators are bullish.
- The target to the upside is the 113.70 level.
Additional key levels
USD/JPY
Overview:
Today Last Price: 113.39
Today Daily change: 47 pips
Today Daily change %: 0.416%
Today Daily Open: 112.92
Trends:
Previous Daily SMA20: 113.2
Previous Daily SMA50: 112.94
Previous Daily SMA100: 112.14
Previous Daily SMA200: 110.26
Levels:
Previous Daily High: 113.02
Previous Daily Low: 112.66
Previous Weekly High: 113.24
Previous Weekly Low: 112.3
Previous Monthly High: 114.56
Previous Monthly Low: 111.38
Previous Daily Fibonacci 38.2%: 112.79
Previous Daily Fibonacci 61.8%: 112.88
Previous Daily Pivot Point S1: 112.71
Previous Daily Pivot Point S2: 112.5
Previous Daily Pivot Point S3: 112.35
Previous Daily Pivot Point R1: 113.08
Previous Daily Pivot Point R2: 113.23
Previous Daily Pivot Point R3: 113.44
