- Little demand for the safe-haven yen keeps USD/JPY near two-months highs.
- USD/JPY is trading near daily highs in the last part of the London session.
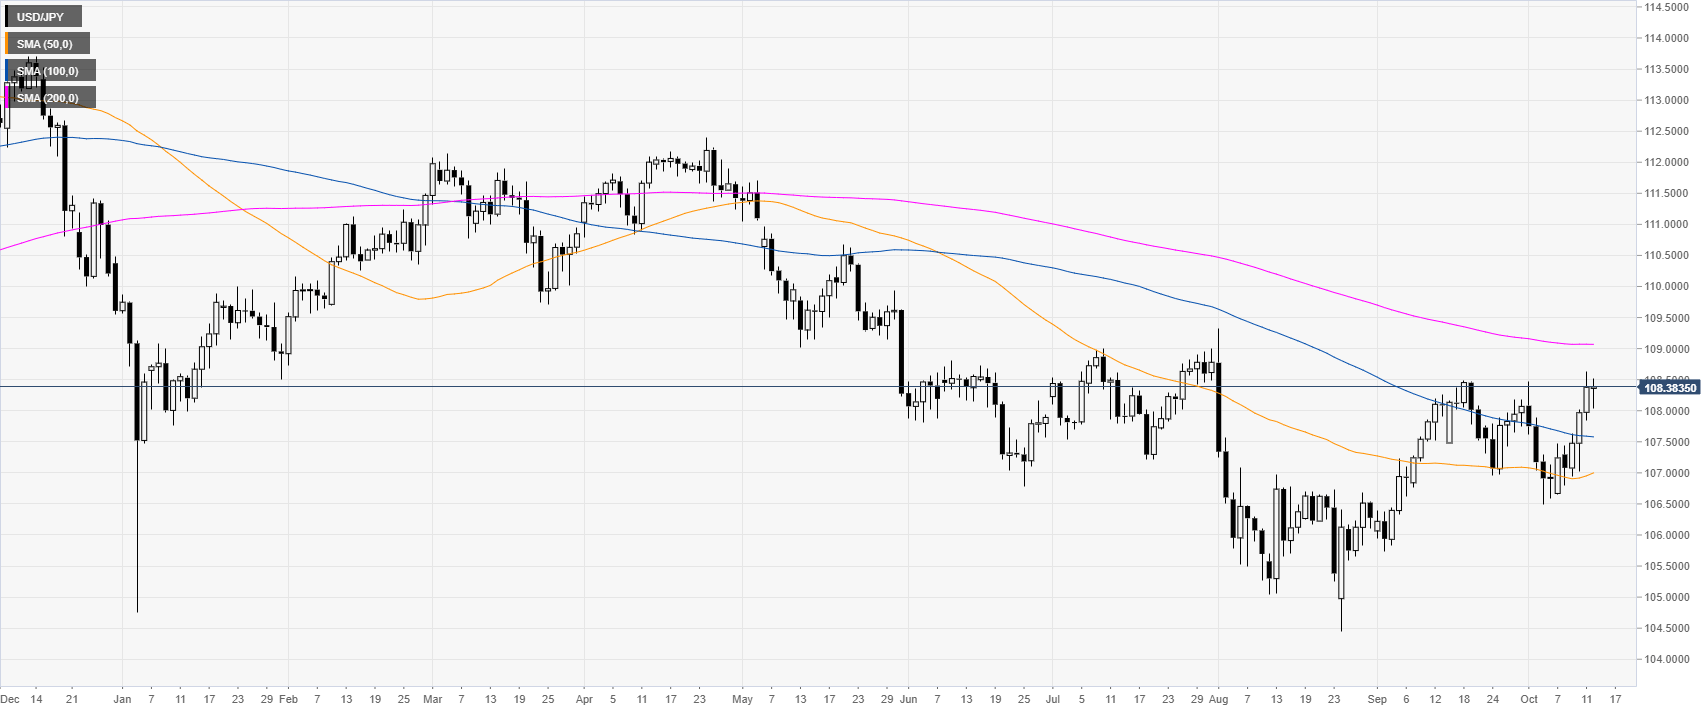
USD/JPY daily chart
The USD/JPY exchange rate is trading in a bear trend below the 200-day simple moving average (DSMA). However, the market is bouncing sharply from the October lows and is now trading near two-months highs. The better market mood is lessening the demand for the safe-haven Yen.
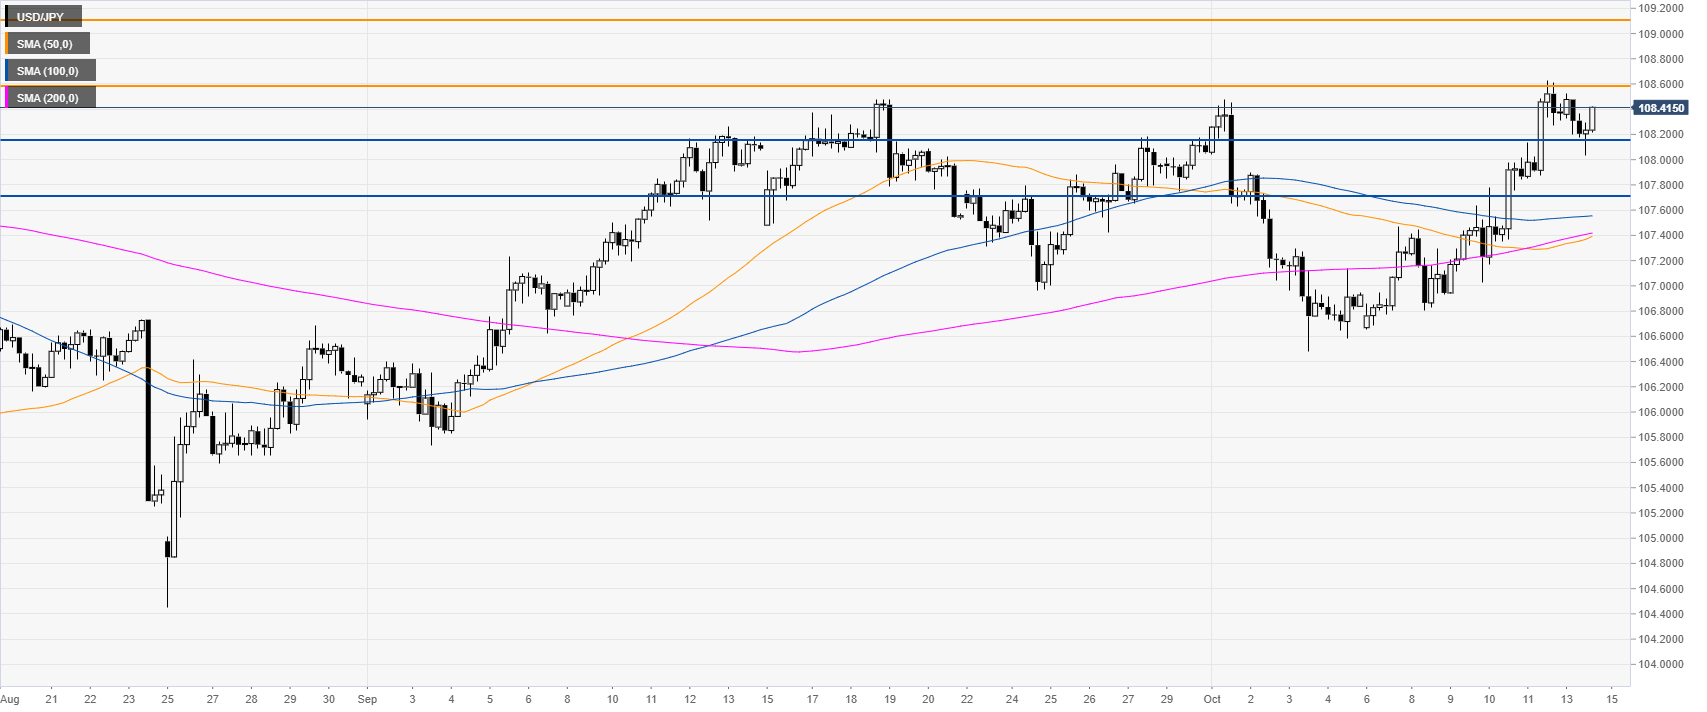
USD/JPY four-hour chart
USD/JPY is trading above the main SMAs on the four-hour chart, suggesting bullish momentum in the medium term. The market is nearing the 108.56 resistance. A daily close above this resistance can open the gates to the 109.12 price level, according to the Technical Confluences Indicator.
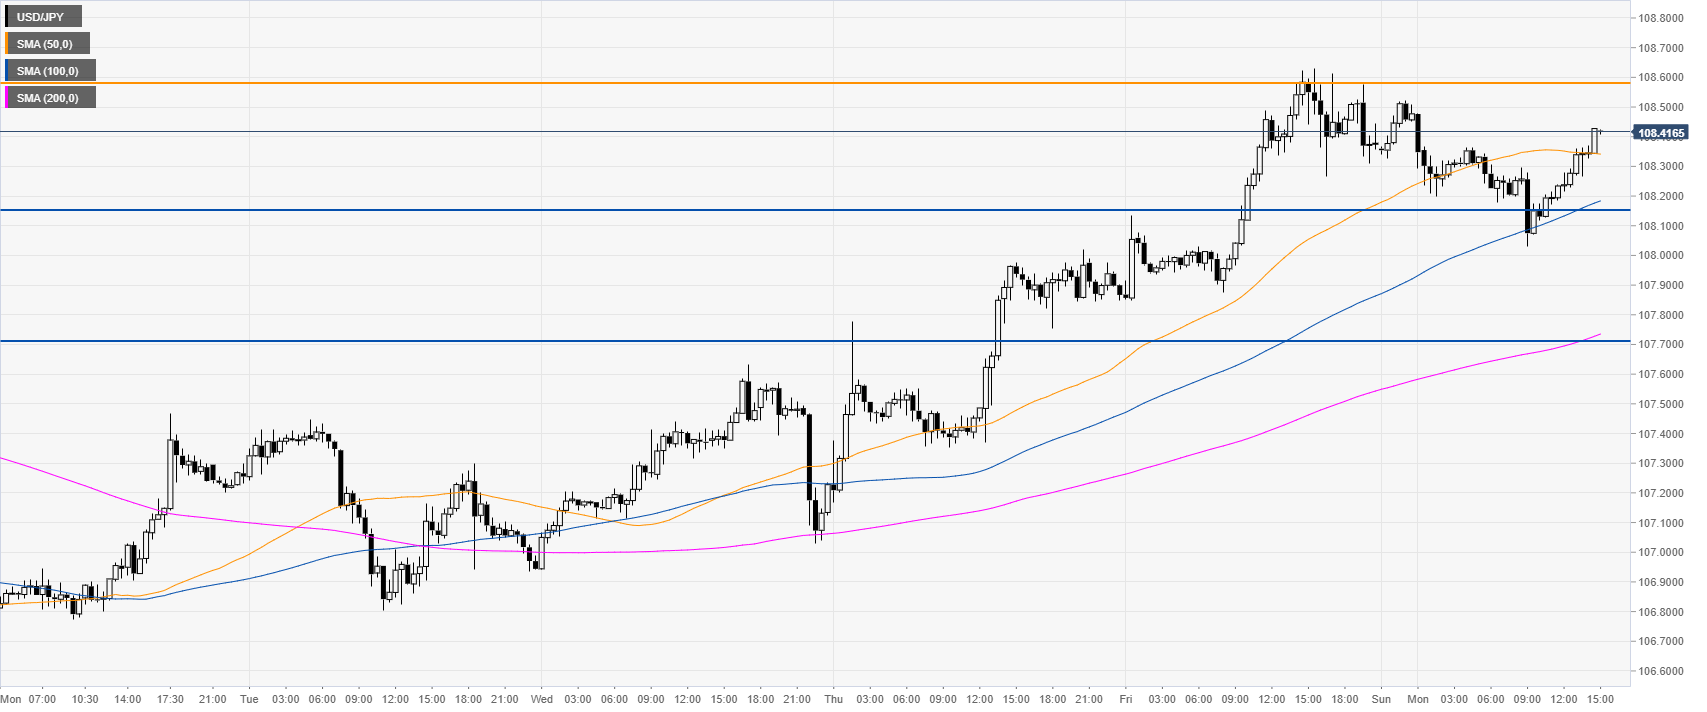
USD/JPY 30-minute chart
The USD/JPY currency pair is trading above its main SMAs, suggesting bullish momentum in the near term. Immediate supports are seen at the 108.16 and 107.70 levels, according to the Technical Confluences Indicator.
Additional key levels
