- The ISM Non-Manufacturing PMI in September disappointed the market dropping to 52.6 in vs. 55 forecast.
- The level to beat for bears is the 106.50 support level.
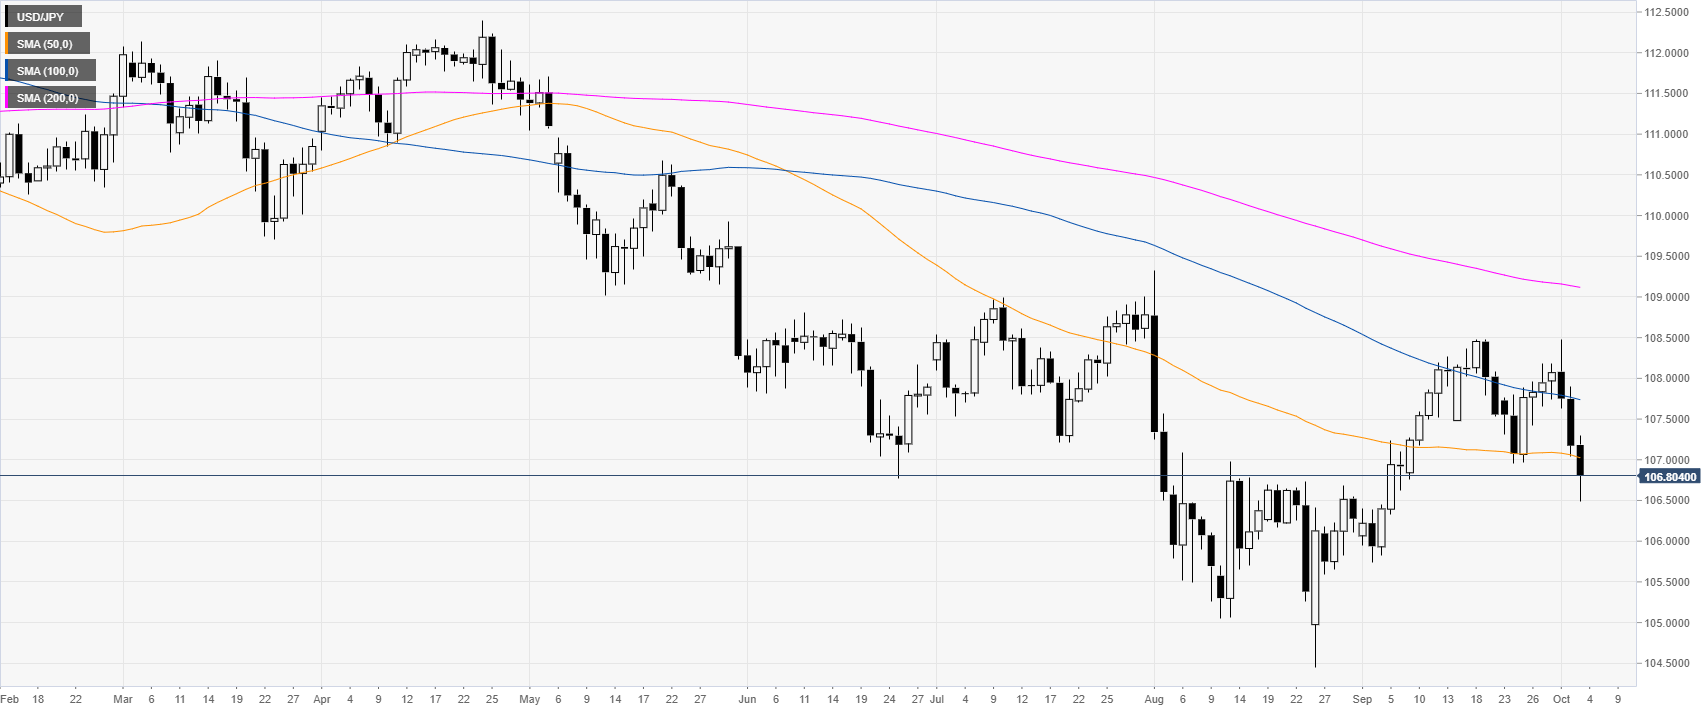
USD/JPY daily chart
USD/JPY is trading in a bear trend below the main simple moving averages (SMAs). The Greenback is on the back foot after worse-than-expected ISM PMI data from the United States this week.
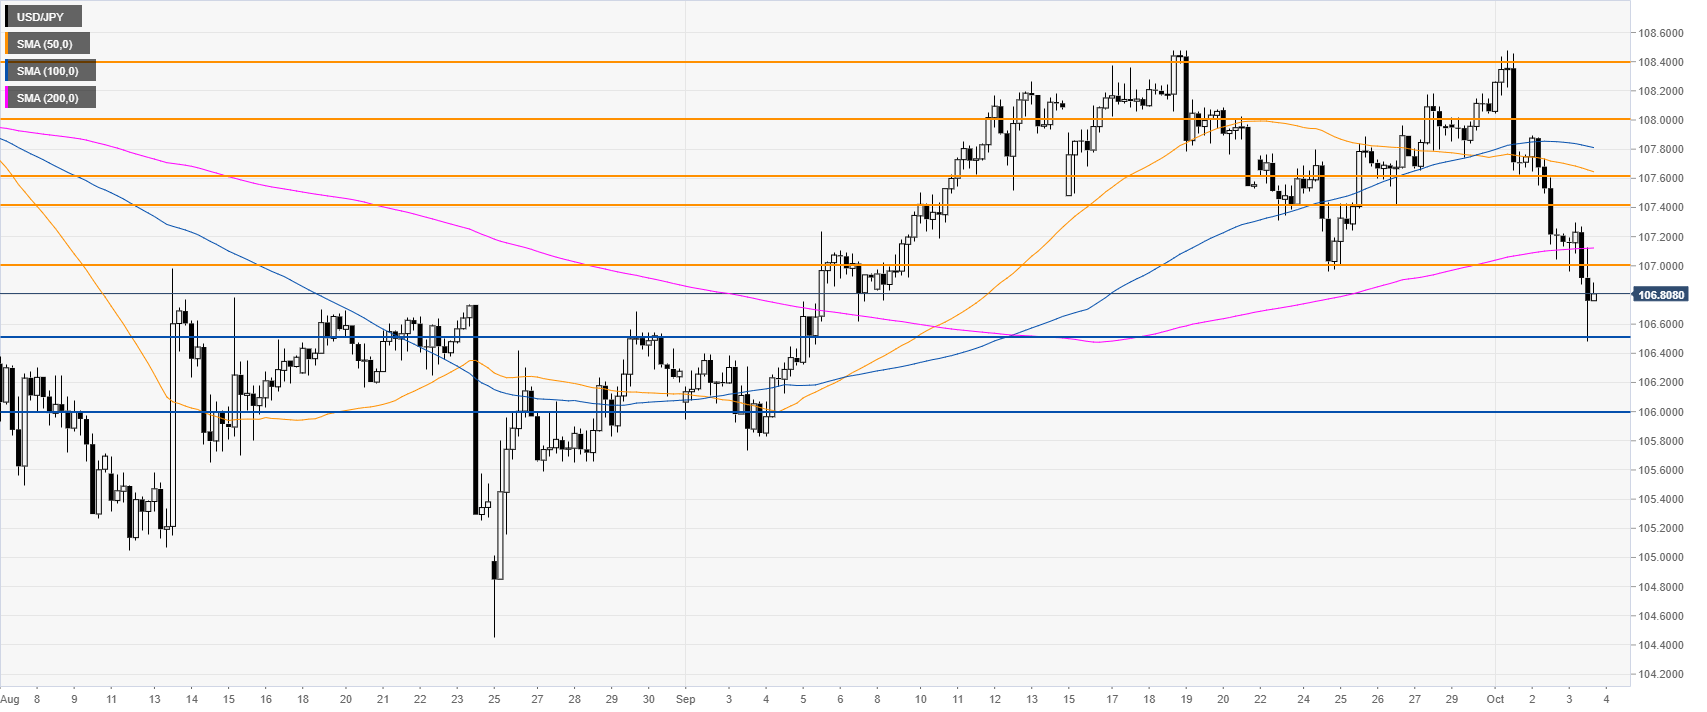
USD/JPY four-hour chart
USD/JPY is under pressure below the 107.00 figure and the 200 SMA. A break below the 106.50 support can expose the 106.00 handle to the downside, according to the Technical Confluences Indicator.
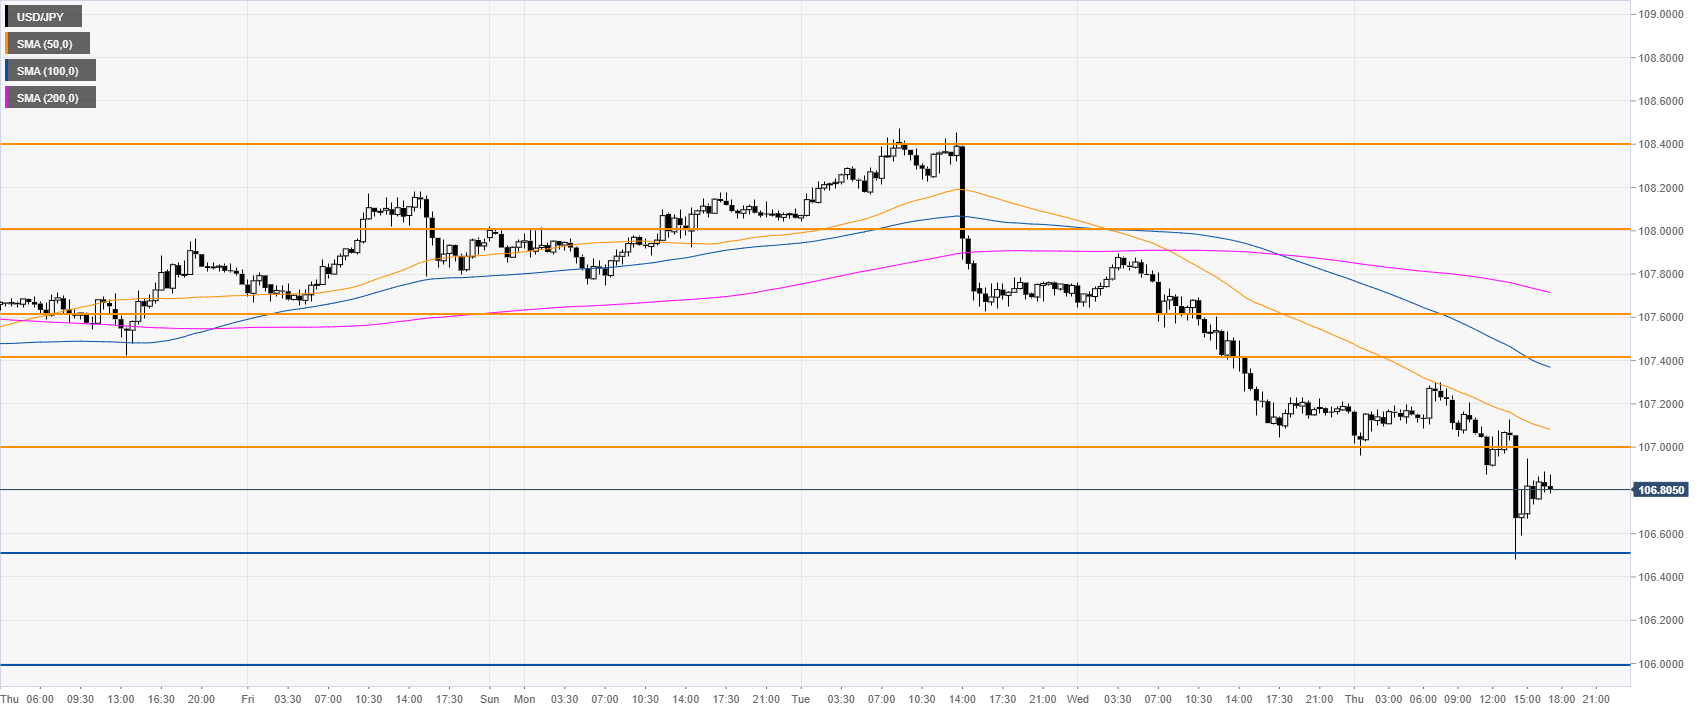
USD/JPY 30-minute chart
The USD/JPY currency pair is under pressure below the main SMAs, suggesting a bearish bias in the near term. Immediate resistances are seen at the 107.00 and 107.40 price levels, according to the Technical Confluences Indicator.
Additional key levels
