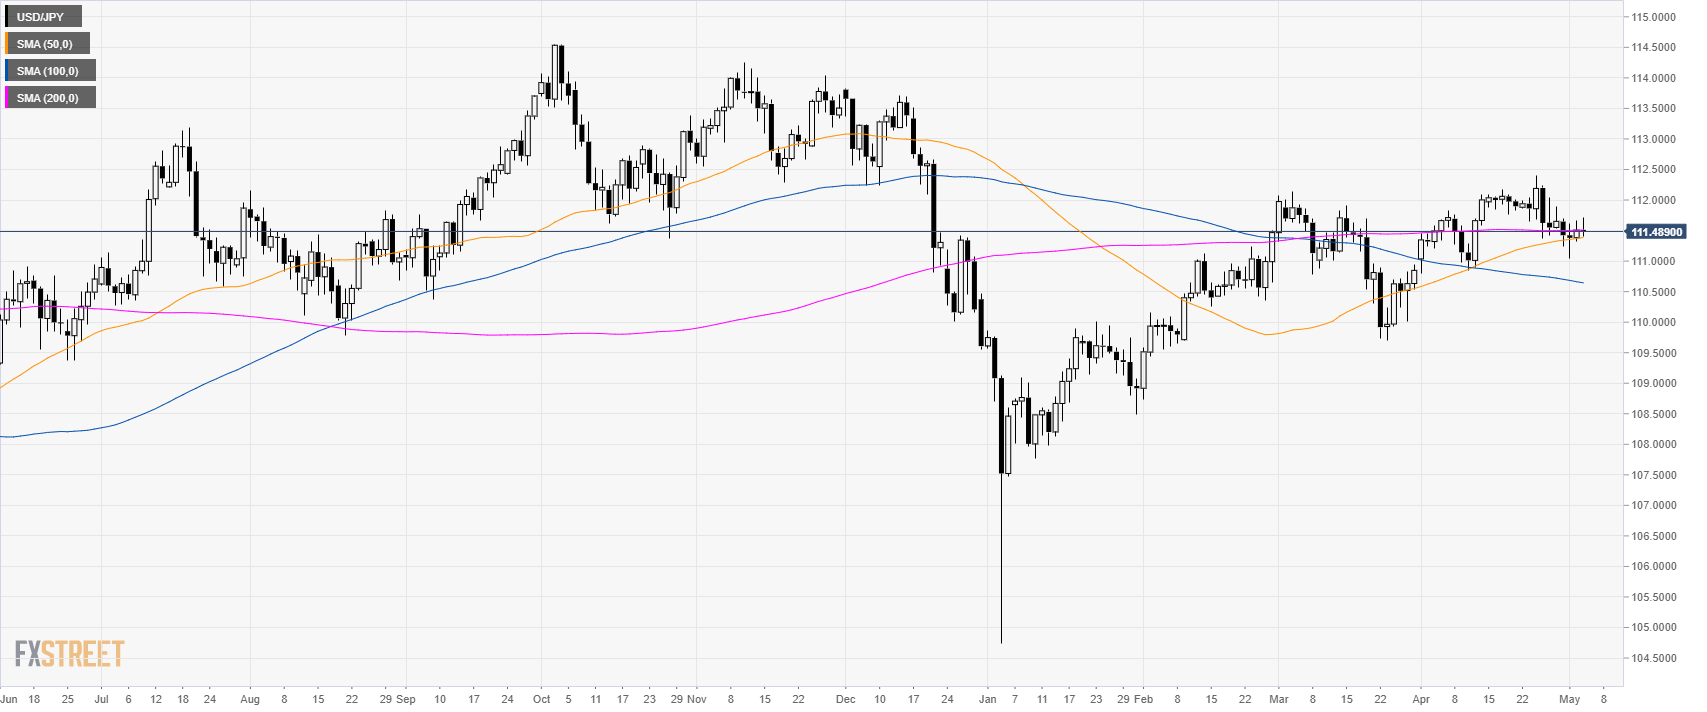
USD/JPY daily chart
- USD/JPY is trading near 111.50 near a flat 200 SMA suggesting a sideways market.
- The US nonfarm payrolls (NFP) came better-than-anticipated at 263K jobs in April vs. 185K expected by analysts while Average Hourly Earnings came in slightly lower than expected at 3.2% vs. 3.3% YoY in April.
- The reaction in the USD is currently negative despite the stellar NFP numbers.
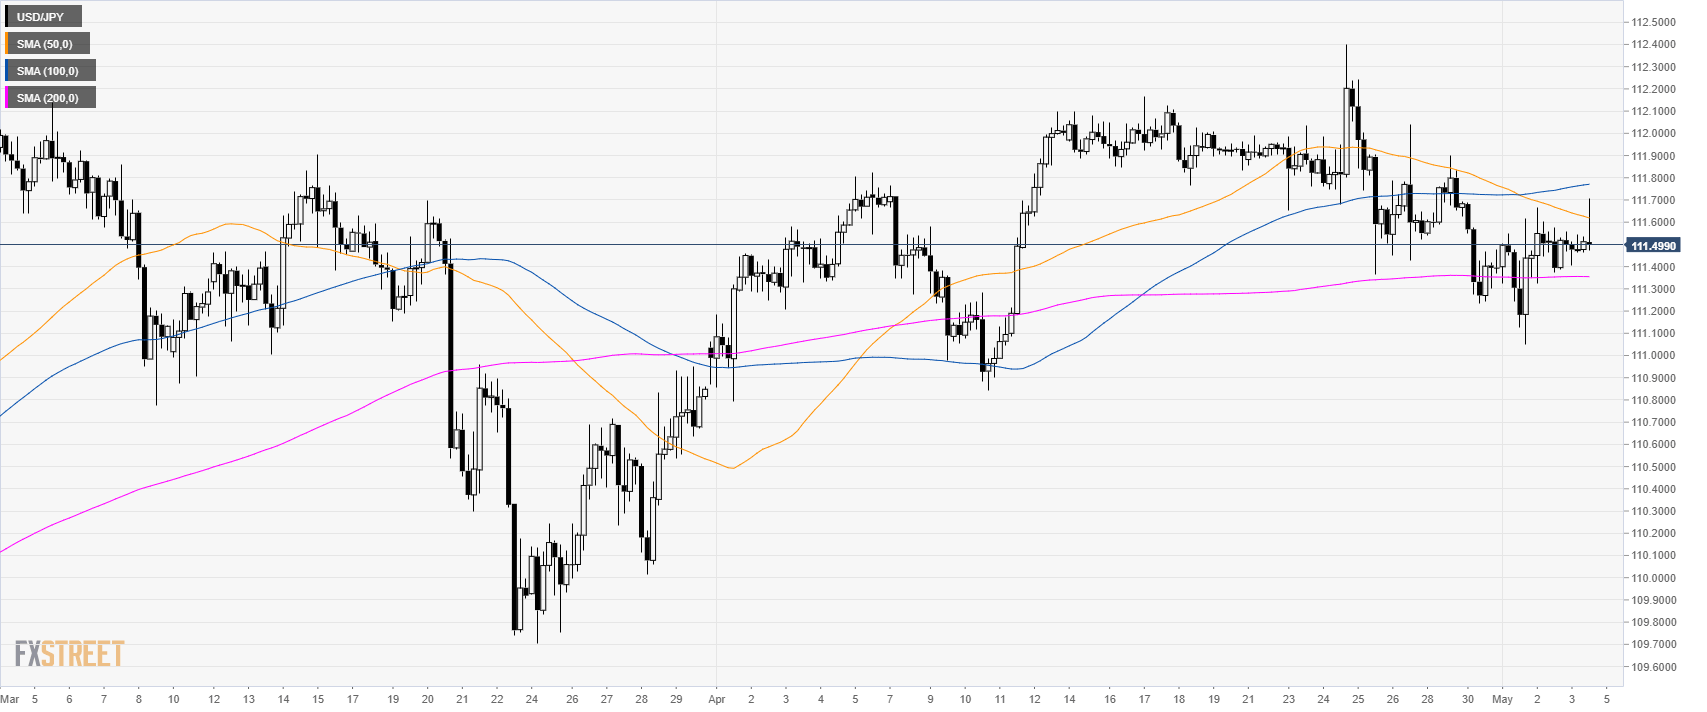
USD/JPY 4-hour chart
- USD/JPY is ranging between the 50 and 200 SMA.
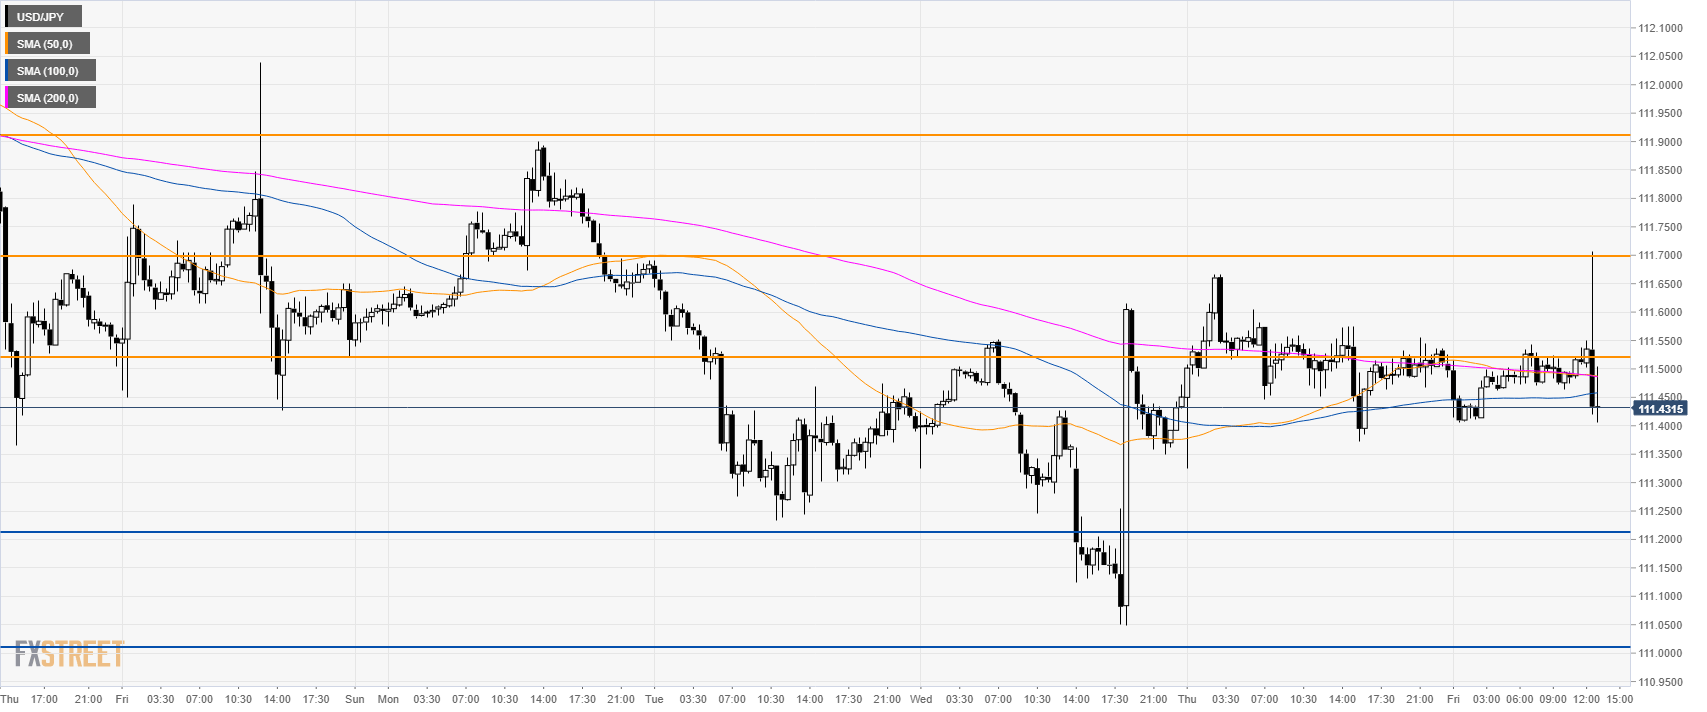
USD/JPY 30-minute chart
- USD/JPY rejected the 111.70 resistance mentioned yesterday.
- The market is now trading below 111.55 and its main SMAs suggesting a bearish bias in the short-term.
- Bears could drive the market to 111.20 and 111.00 figure while the overall picture on the Yen remains quite neutral for the time being.
Additional key levels
