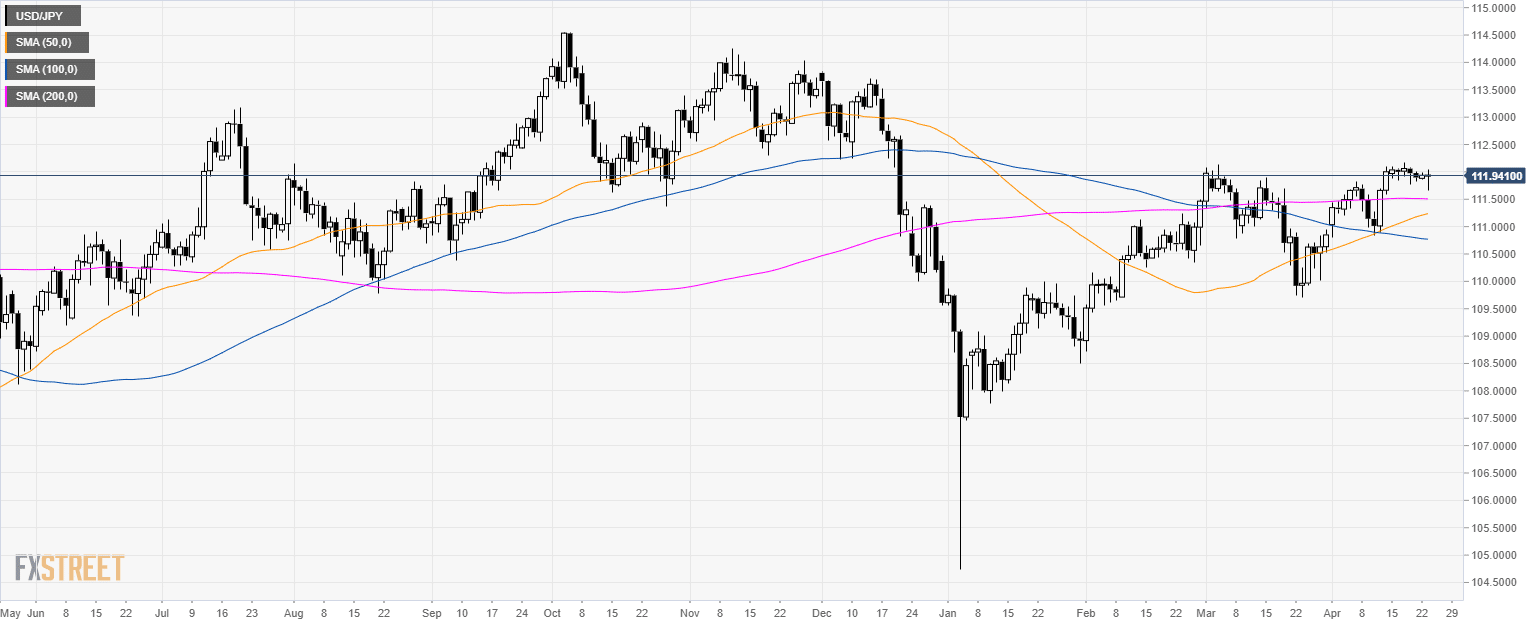
USD/JPY daily chart
- USD/JPY is trading sideways above its 200-day simple moving average (SMA).
- Despite broad-based USD strength USD/JPY remains stuck near 112.00 figure.
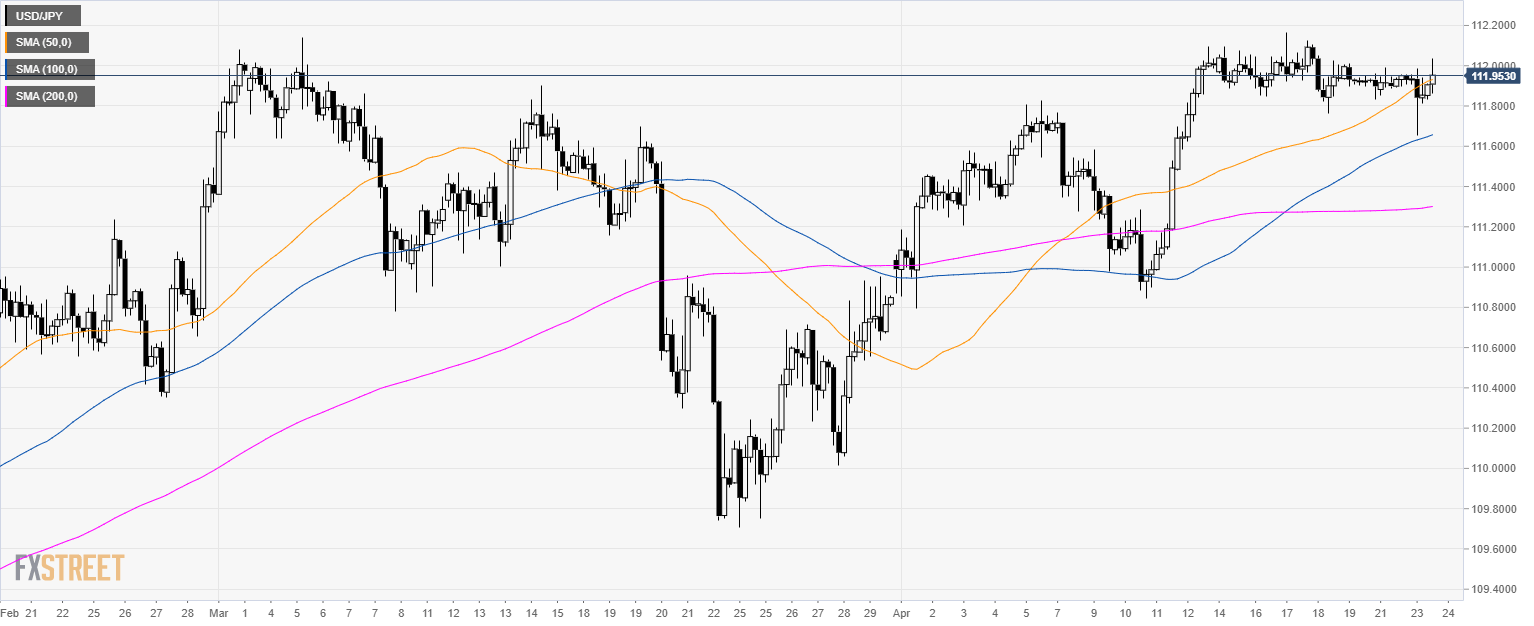
USD/JPY 4-hour chart
- USD/JPY is challenging the 50 SMA.
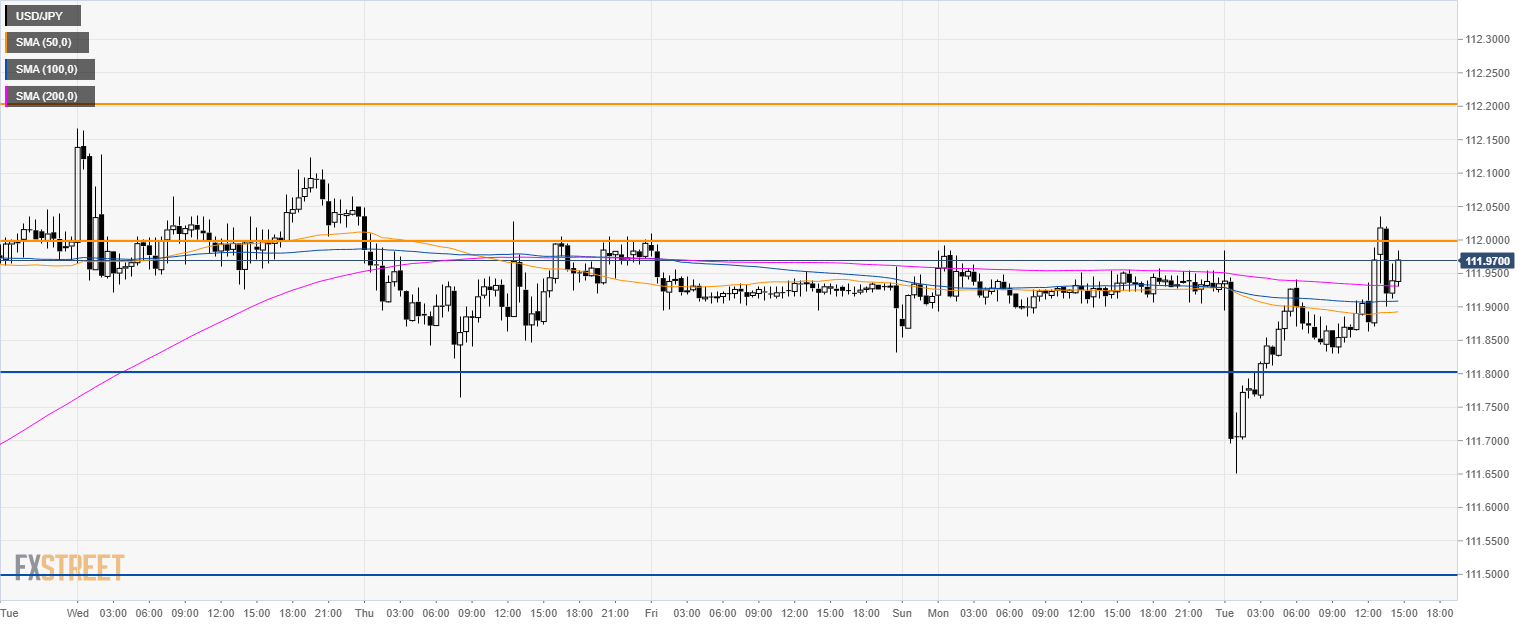
USD/JPY 30-minute chart
- As the 112.00 resistance continues to cap any advances, the levels to the downside near 111.80, 111.50 and 111.30 remain exposed to bearish attempts.
- A clear break above 112.00 figure can lead to 112.20 resistance.
Additional key levels
