- Bulls are back in charge as the USD is gathering strength accross the board.
- The next resistance in line is at 108.85.
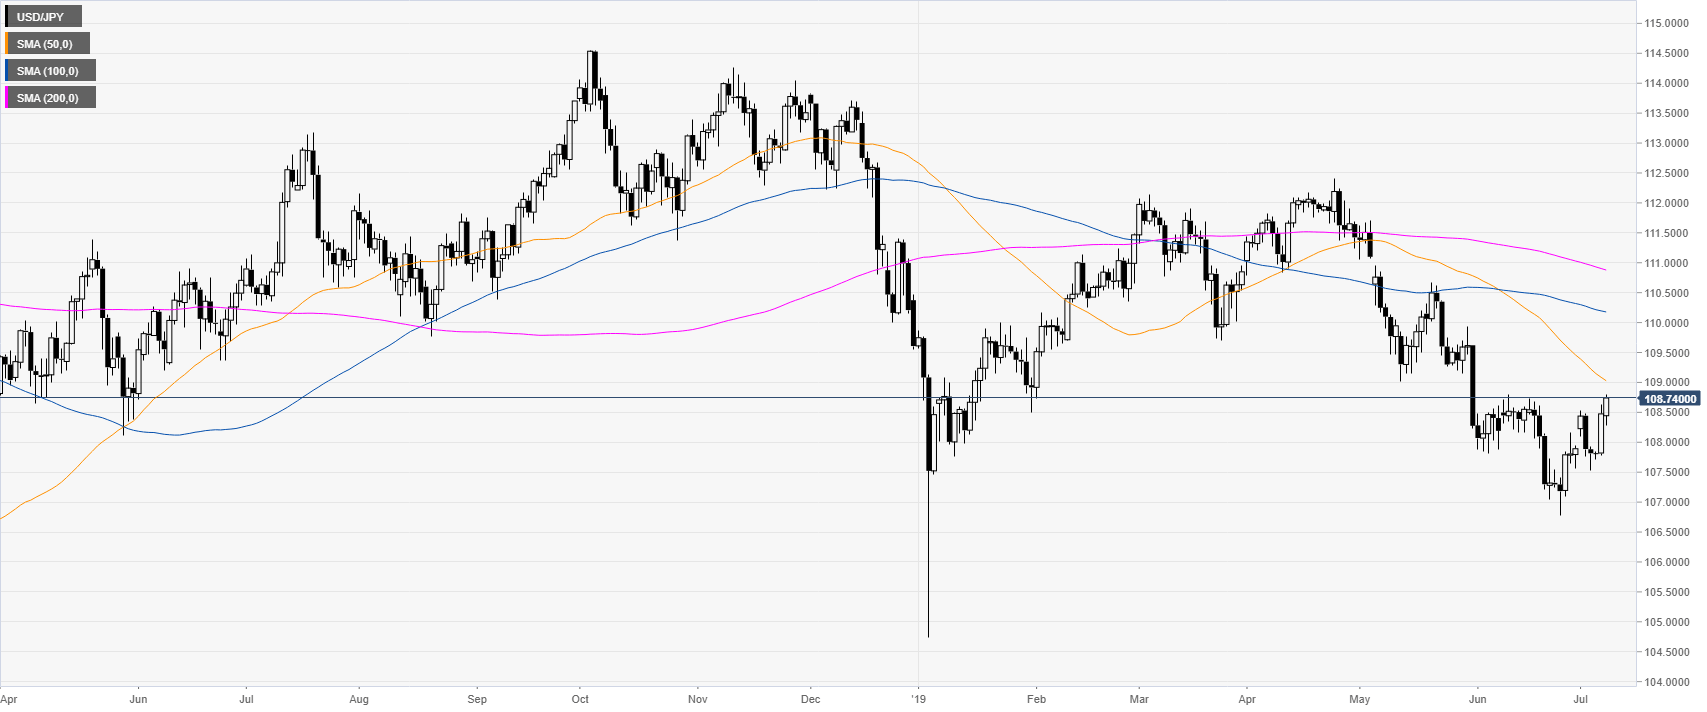
USD/JPY daily chart
USD/JPY is trading in a bull leg under the main daily simple moving averages (DSMAs). The market is challening the 108.85 resistance.
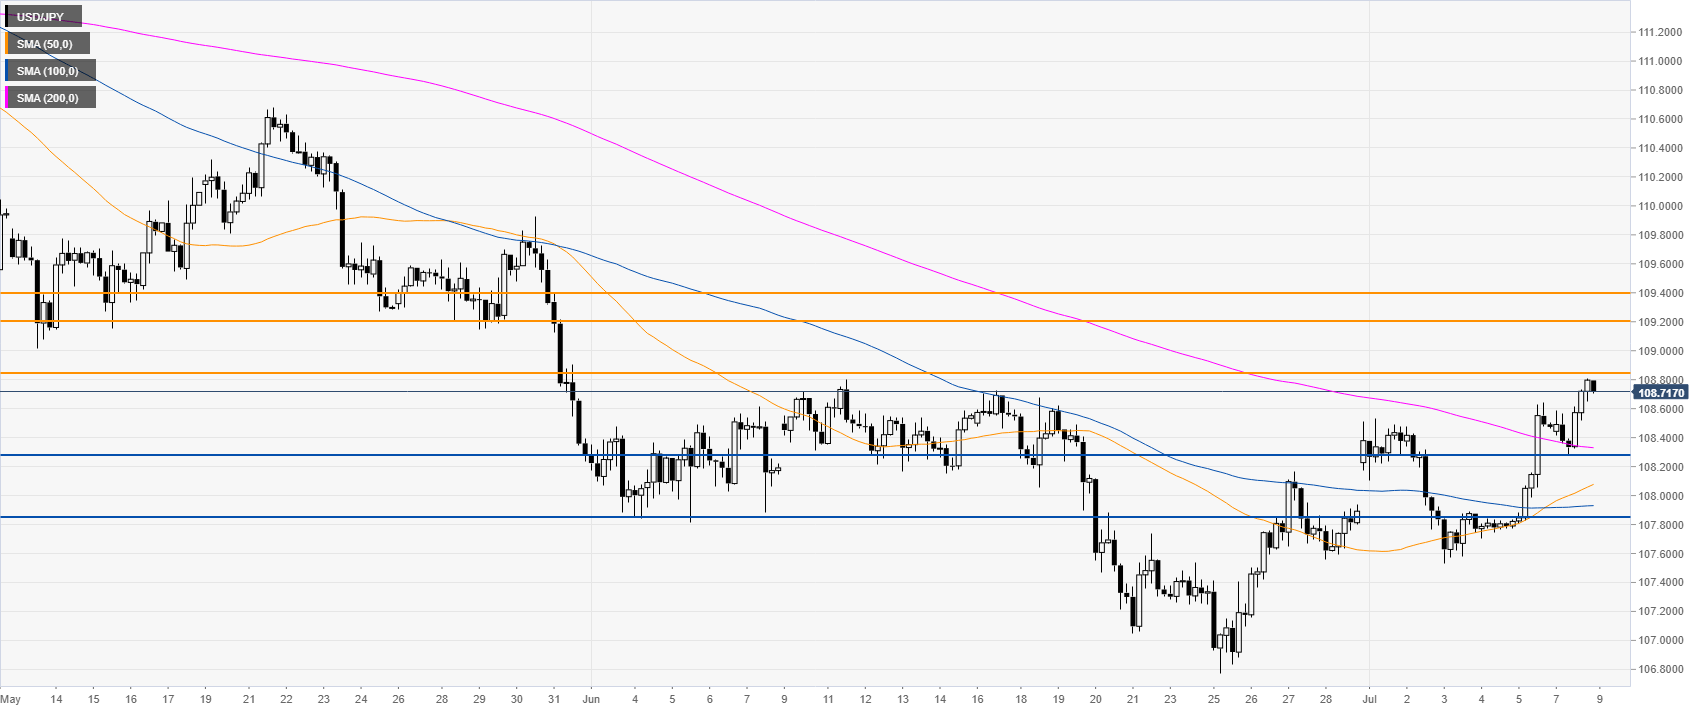
USD/JPY 4-hour chart
The market is trading above its main SMAs suggesting bullish momentum in the medium term. Bulls want to trade above 108.85 resistance in order to reach 109.20 and 109.37 resistances to the upside.
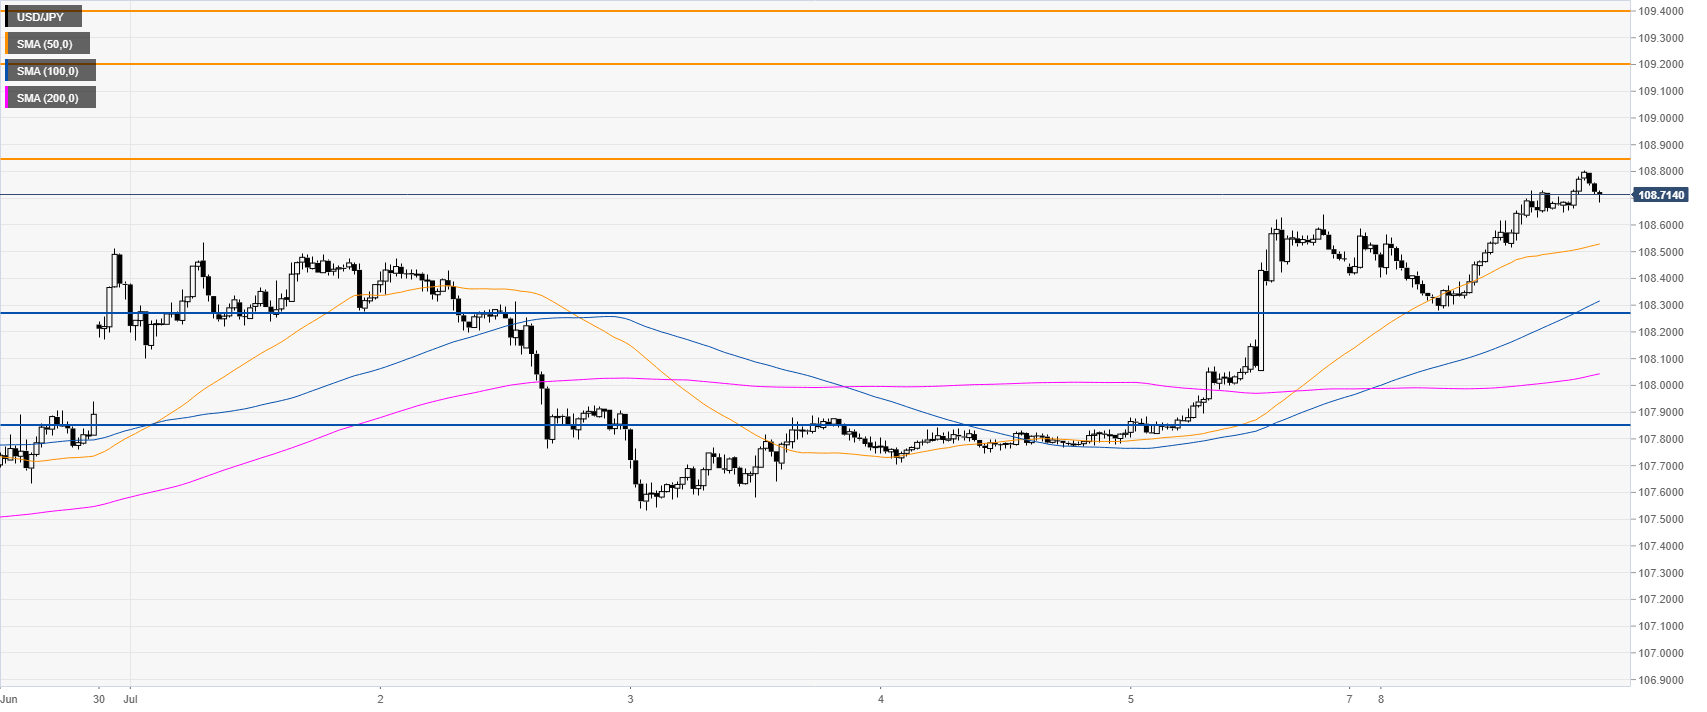
USD/JPY 30-minute chart
USD/JPY is bullish above its main SMAs. Immediate support can be seen at 108.25 and 107.85, according to the Technical Confluences Indicator.

Additional key levels