- USD/JPY remains trapped in a sideways consolidation.
- The level to beat for sellers is the 108.45 support.
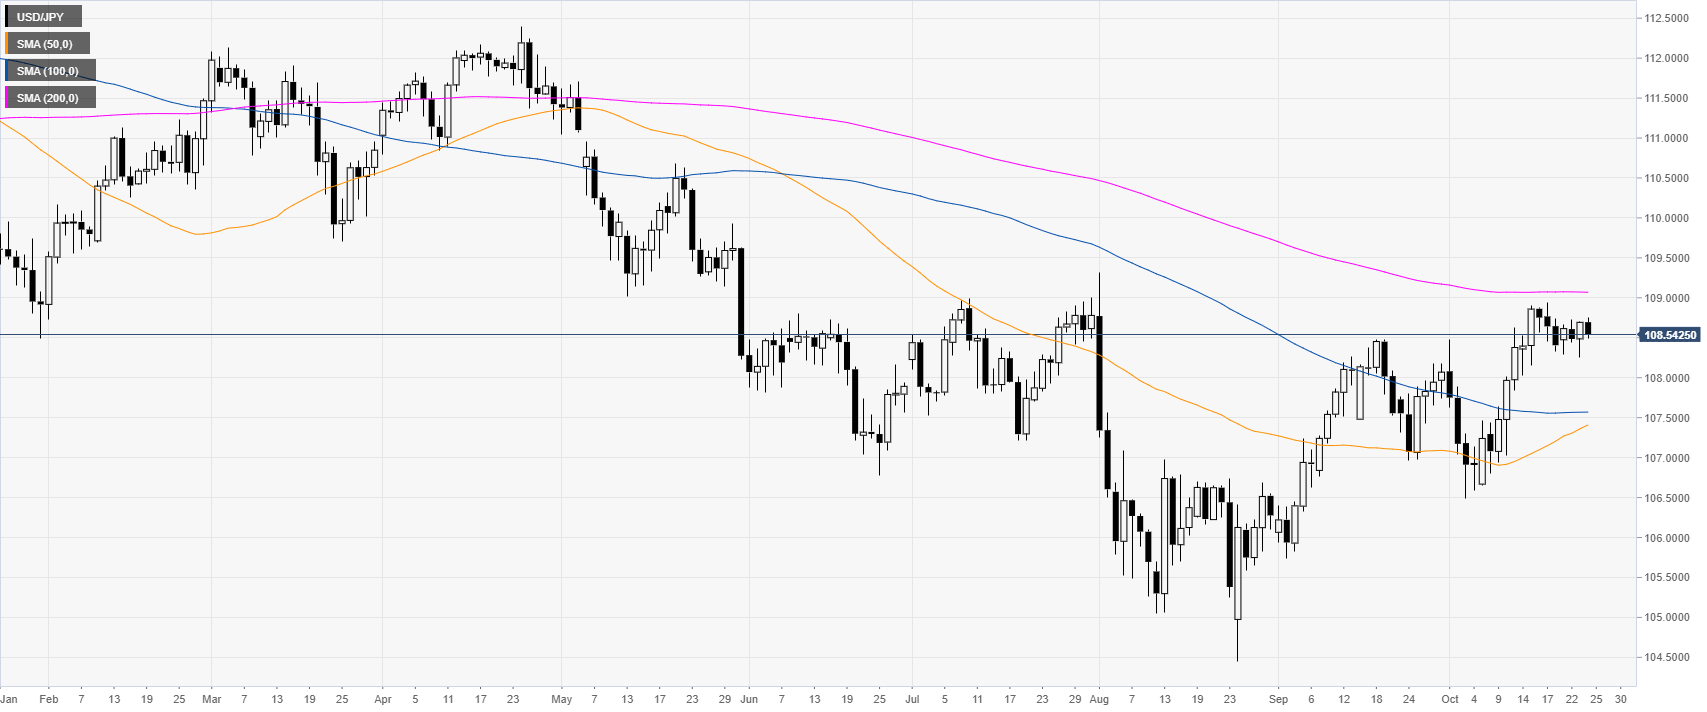
USD/JPY daily chart
USD/JPY is trading in a downtrend below its 200-day simple moving average (DMA). The market is in consolidation mode after the October bull run.
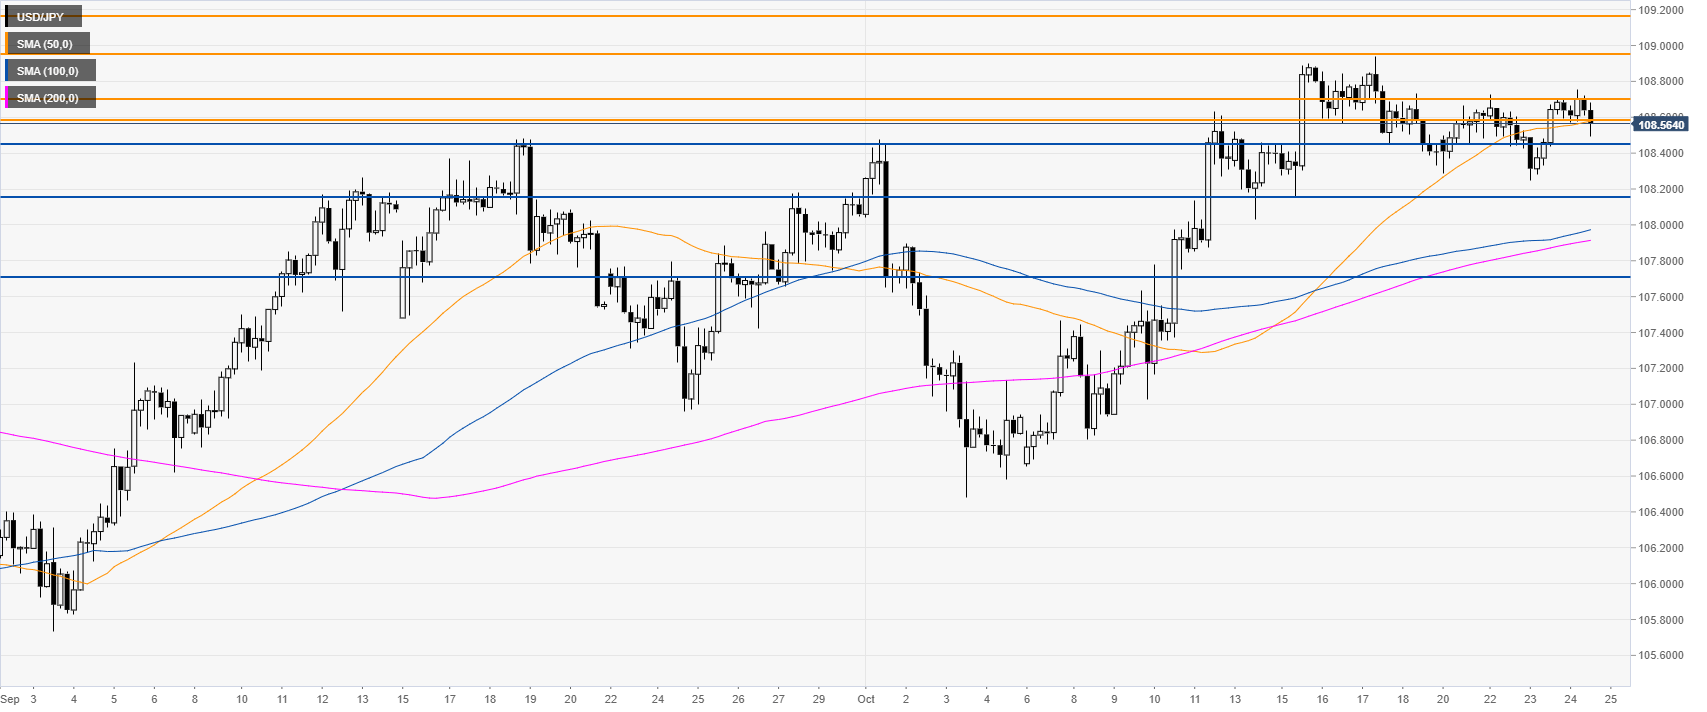
USD/JPY four-hour chart
USD/JPY is trading sideways near its 50 SMA on the four-hour chart, suggesting a neutral bias in the medium term. Bulls need to overcome the 108.70 resistance to travel towards the 108.95 price level, according to the Technical Confluences Indicator. Further up lies the 109.16 level.
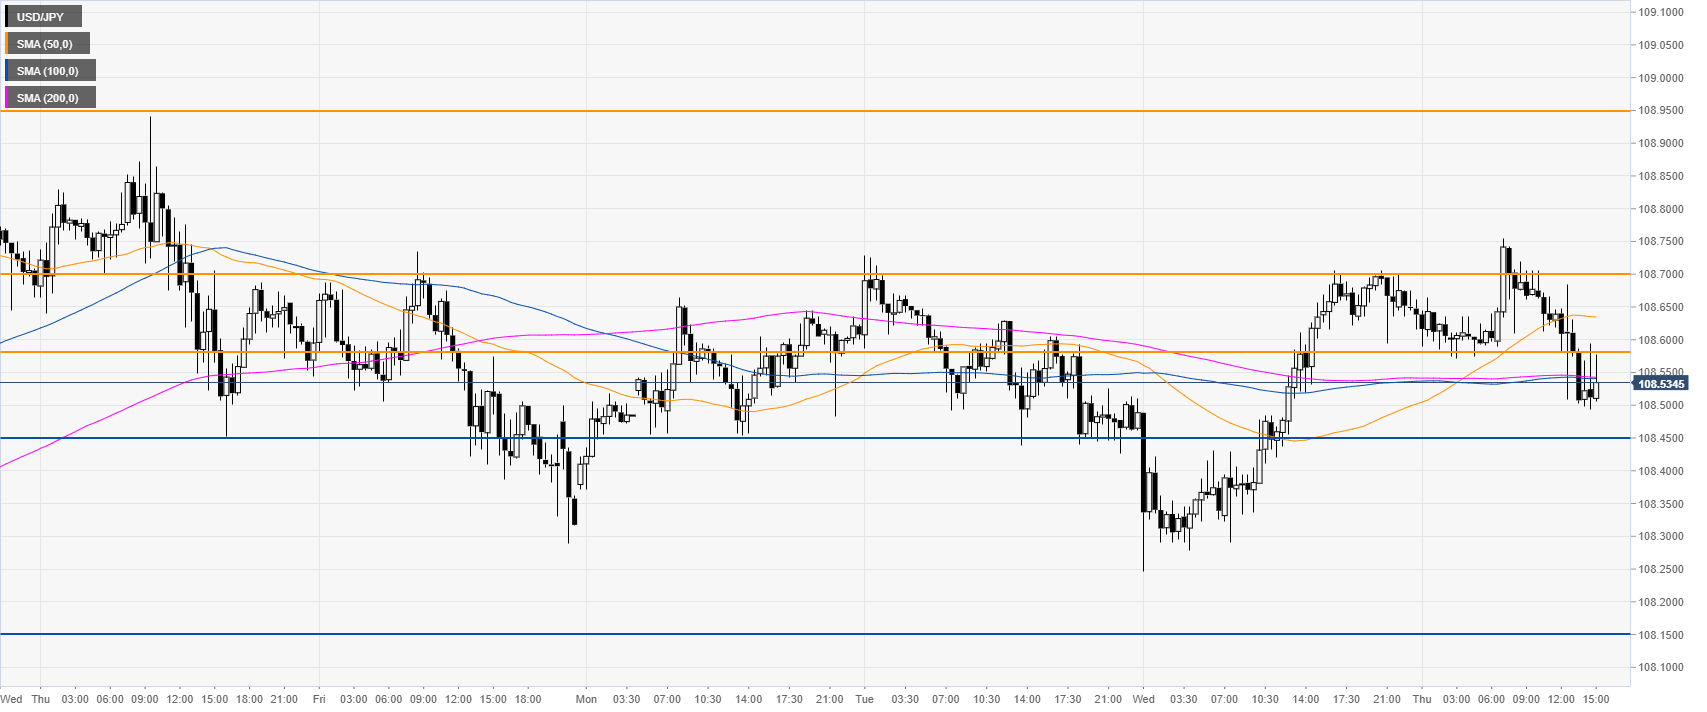
USD/JPY 30-minute chart
USD/JPY is trading near daily lows near the 108.56 resistance. Support is seen at the 108.45 and 108.15 levels, according to the Technical Confluences Indicator.
Additional key levels
