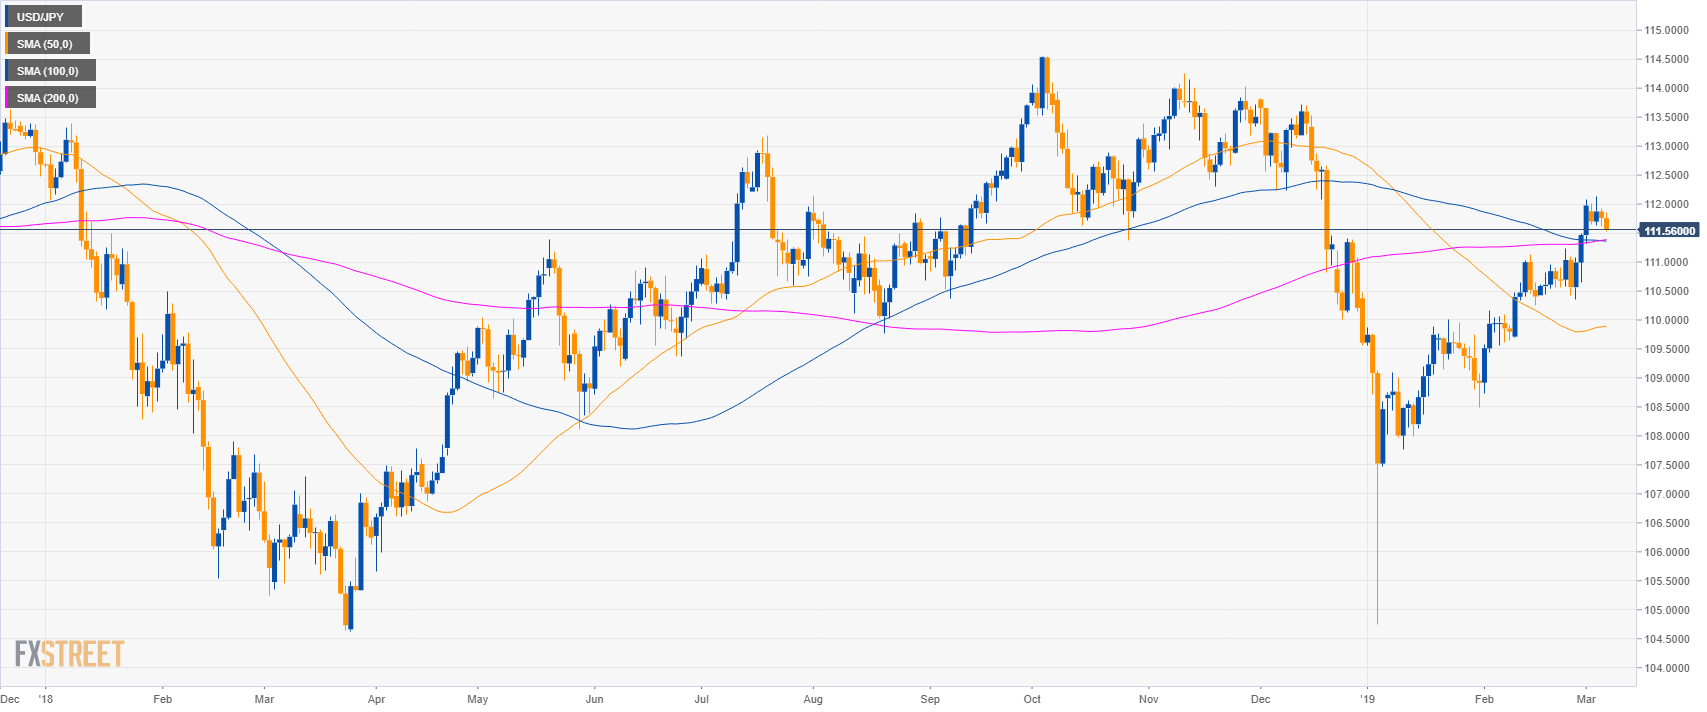
USD/JPY daily chart
- USD/JPY is trading in a bull leg above its main simple moving averages.
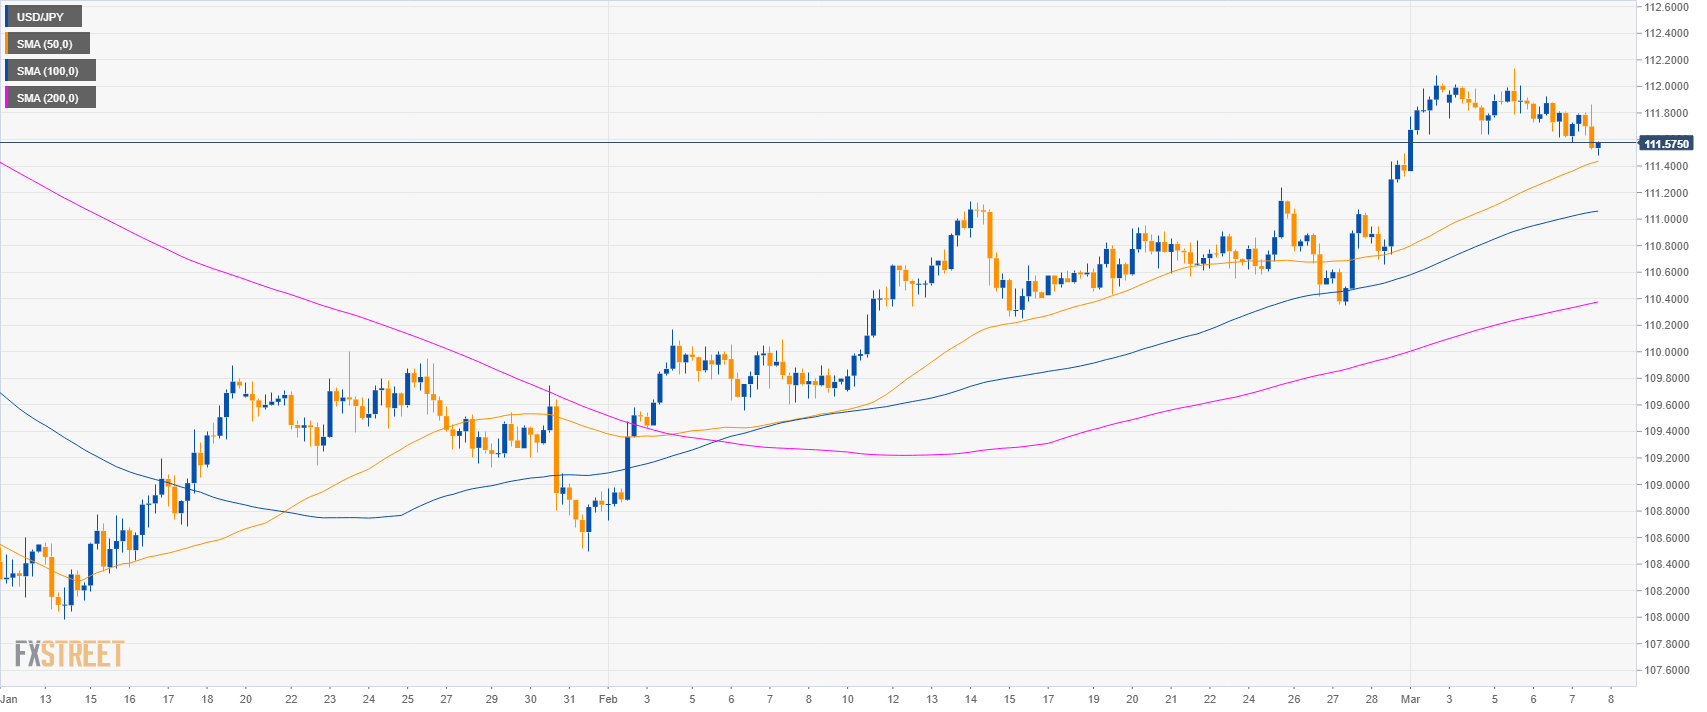
USD/JPY 4-hour chart
- USD/JPY is trading above its main SMAs suggesting bullish momentum in the medium-term.
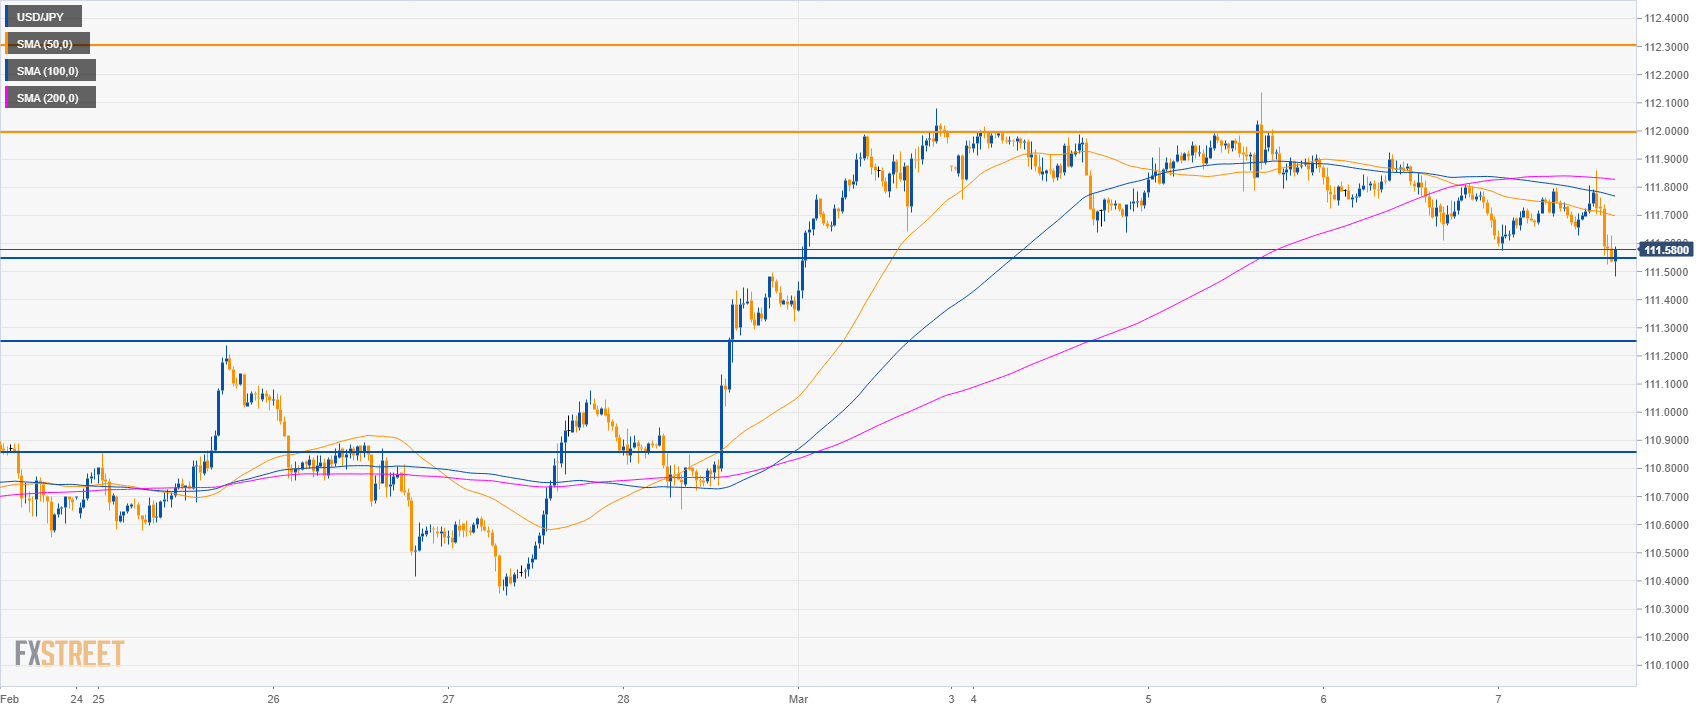
USD/JPY 30-minute chart
- USD/JPY is trading below its main SMAs suggesting bearish momentum in the short-term.
- A break below 111.55 on a daily closing basis can lead to 111.25 and 110.85 level.
- Resistances to the upside are at 112.00 and 112.30 level.
Additional key levels
USD/JPY
Overview:
Today Last Price: 111.54
Today Daily change: -22 pips
Today Daily change %: -0.20%
Today Daily Open: 111.76
Trends:
Daily SMA20: 110.86
Daily SMA50: 109.88
Daily SMA100: 111.37
Daily SMA200: 111.38
Levels:
Previous Daily High: 111.92
Previous Daily Low: 111.61
Previous Weekly High: 112.08
Previous Weekly Low: 110.35
Previous Monthly High: 111.5
Previous Monthly Low: 108.73
Daily Fibonacci 38.2%: 111.73
Daily Fibonacci 61.8%: 111.8
Daily Pivot Point S1: 111.6
Daily Pivot Point S2: 111.45
Daily Pivot Point S3: 111.29
Daily Pivot Point R1: 111.92
Daily Pivot Point R2: 112.08
Daily Pivot Point R3: 112.23
