- USD/JPY is hovering below the monthly high below the 108.50 resistance.
- The market is awaiting the FOMC scheduled at 18:00 GMT.
USD/JPY daily chart
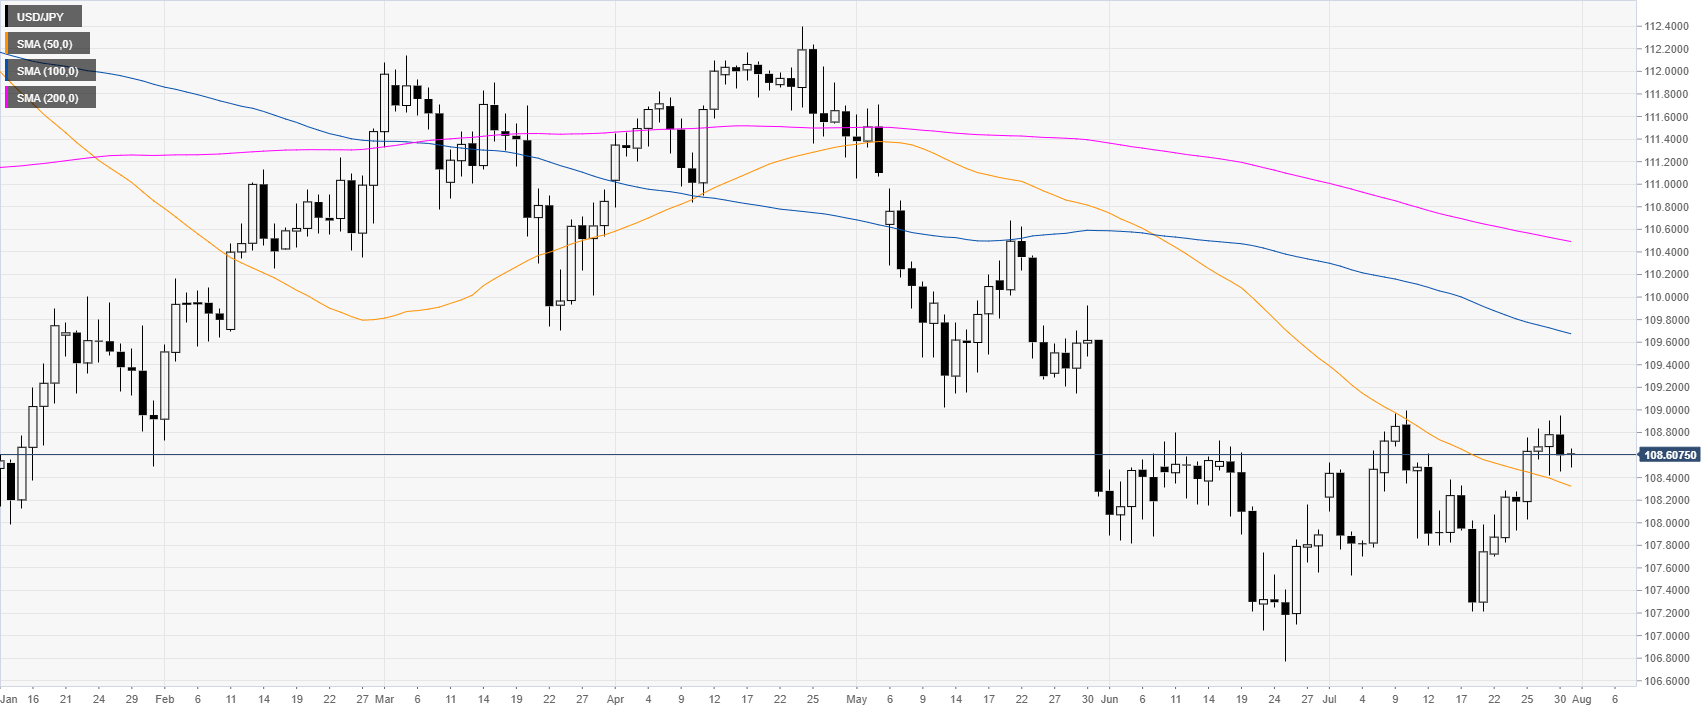
USD/JPY is off the monthly highs as the market is trading above the 50-day simple moving average (DSMA). The market is expeceting the Federal Reserve to cut 25bps this Wednesday. However market participants are going to pay close attention to any comments from Fed’s Chairman Powell.
USD/JPY 4-hour chart
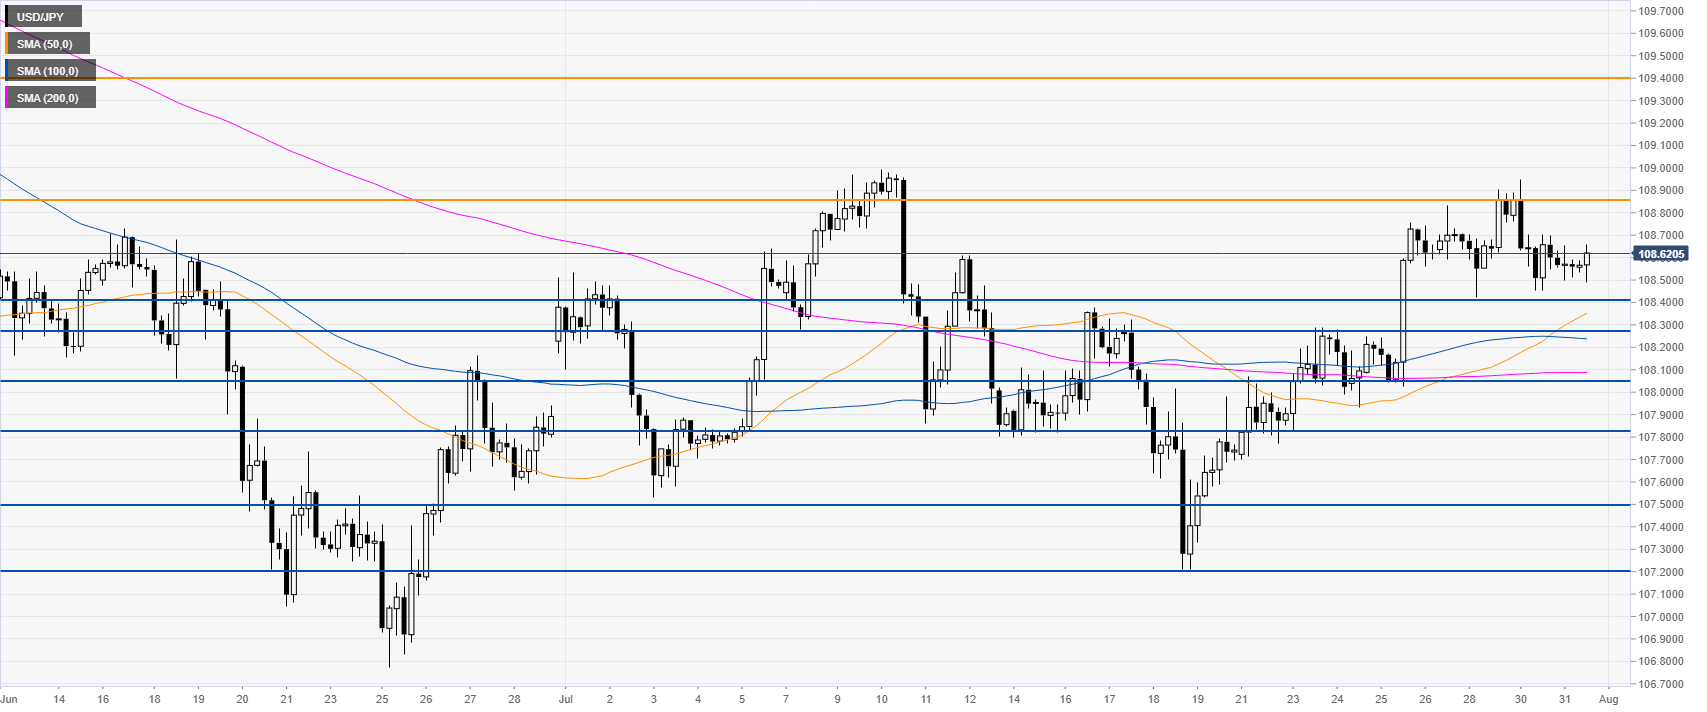
USD/JPY is above its main SMAs, suggesting a bullish bias in the medium term. Bulls need a breakout above 108.50 to get to 109.40 resistance on the way up, according to the Technical Confluences Indicator.
USD/JPY 30-minute chart
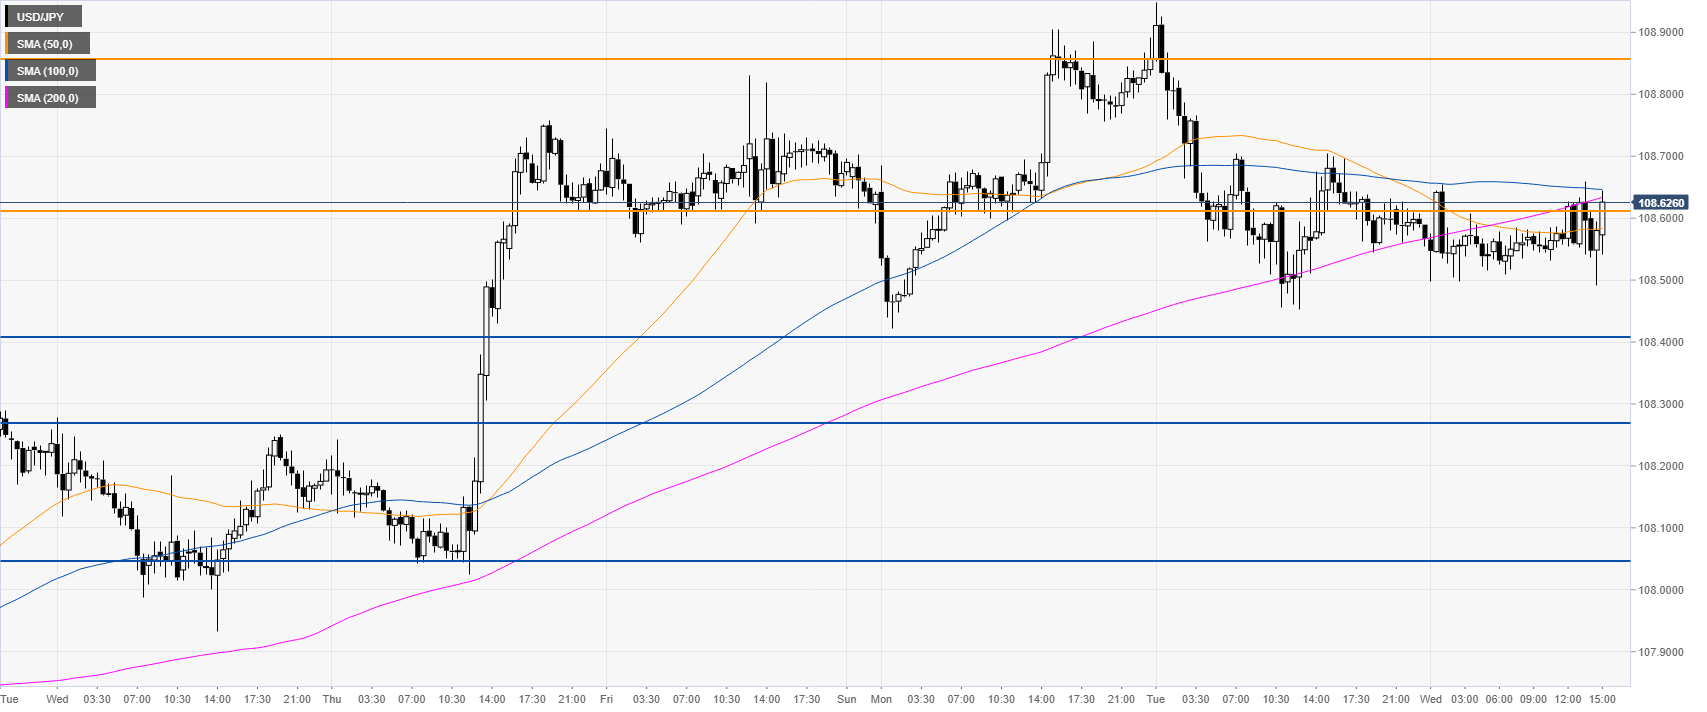
USD/JPY is trading below the 100 and 200 SMAs, suggesting a potential pullback down in the near term. The market might declines towards the 108.41 and 108.03 support levels, according to the Technical Confluences Indicator.
Additional key levels


