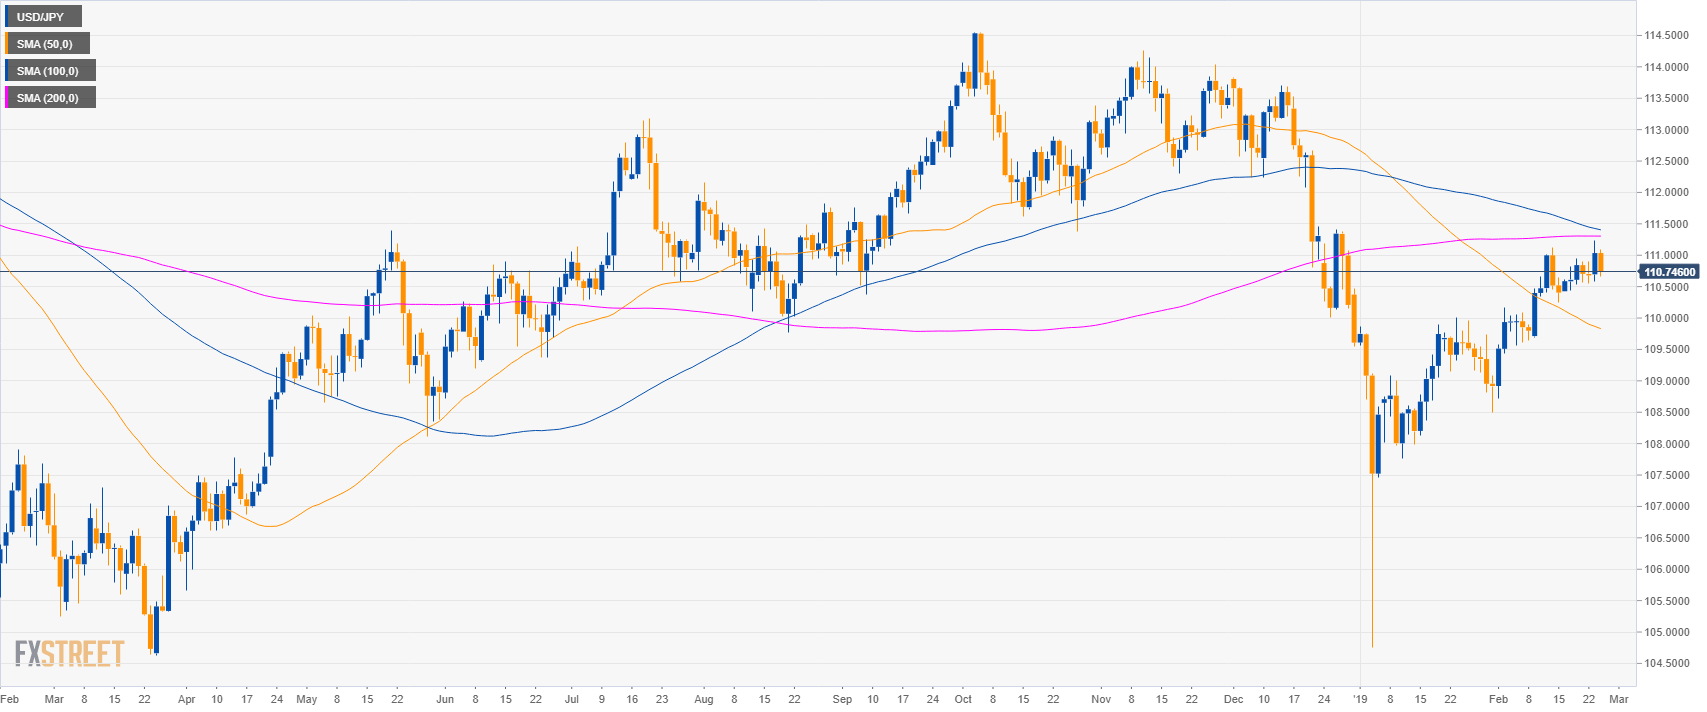
USD/JPY daily chart
- USD/JPY is trading just below the 200-day simple moving average (SMA). US Federal Reserve Chairman, Jerome Powell will be testifying at 14.45 GMT.
- US Federal Reserve Chairman, Jerome Powell will be testifying at 14.45 GMT.
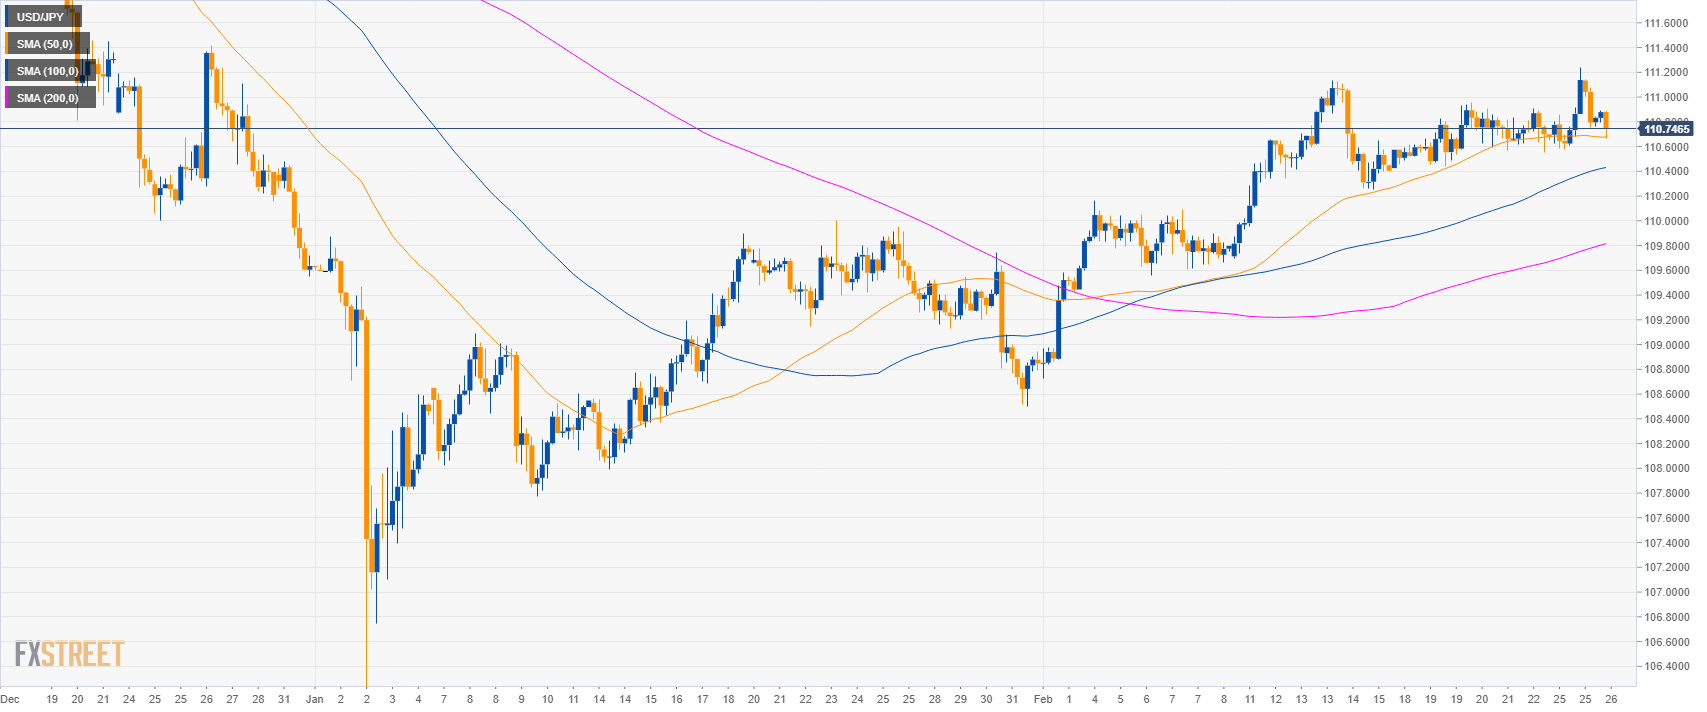
USD/JPY 4-hour chart
- USD/JPY is trading above its main SMAs suggesting bullish momentum in the medium-term.
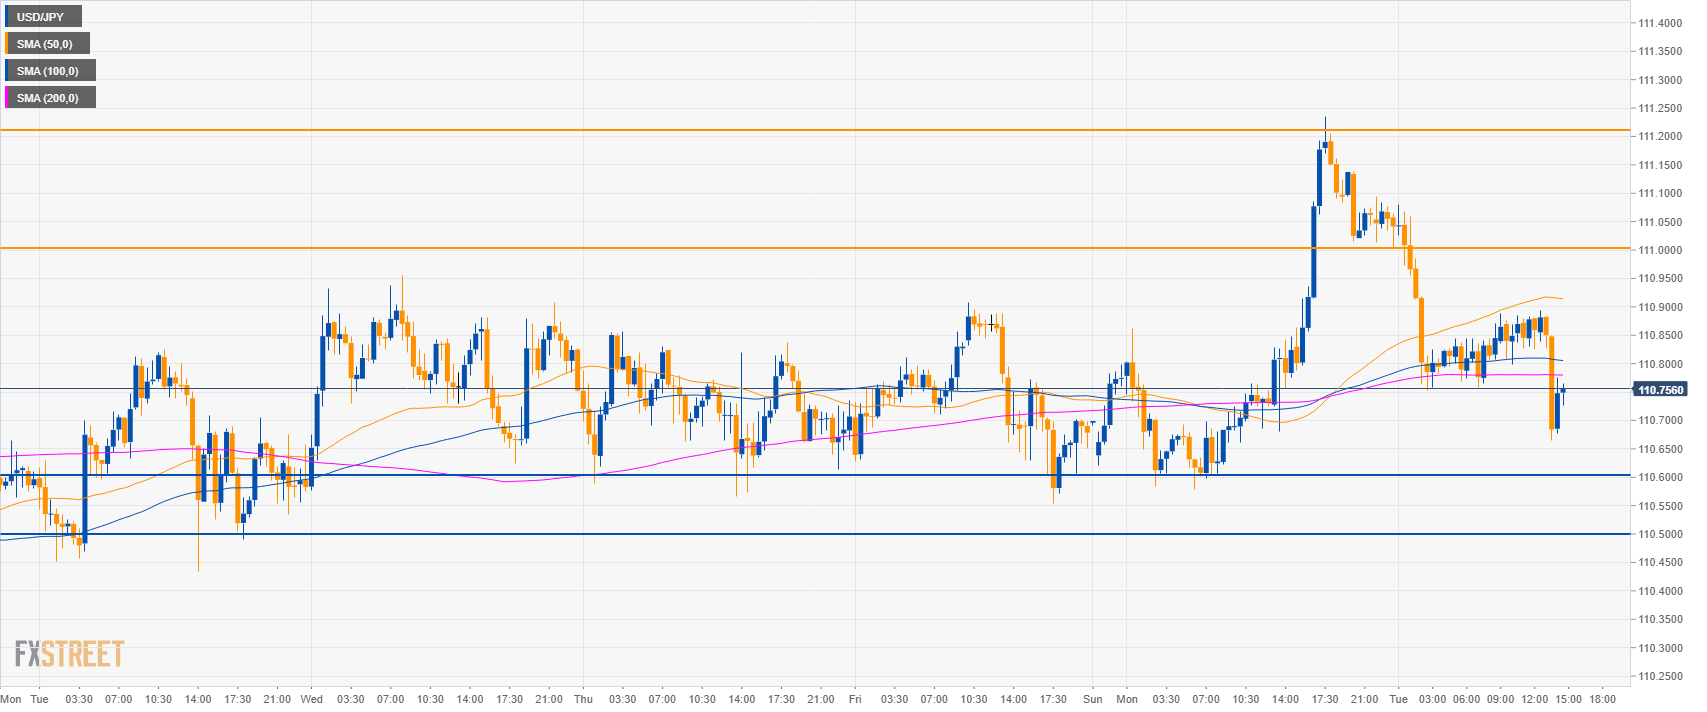
USD/JPY 30-minute chart
- USD/JPY is trading below its main SMAs suggesting bearish momentum in the short-term.
- Bears will try to reach 110.51 and 109.30 to the downside.
- Resistance is at 111.00 and 111.23 level.
Additional key levels
USD/JPY
Overview:
Today Last Price: 110.75
Today Daily change: 28 pips
Today Daily change %: -0.25%
Today Daily Open: 111.03
Trends:
Daily SMA20: 110.17
Daily SMA50: 109.87
Daily SMA100: 111.43
Daily SMA200: 111.31
Levels:
Previous Daily High: 111.24
Previous Daily Low: 110.58
Previous Weekly High: 110.96
Previous Weekly Low: 110.42
Previous Monthly High: 110
Previous Monthly Low: 104.75
Daily Fibonacci 38.2%: 110.99
Daily Fibonacci 61.8%: 110.83
Daily Pivot Point S1: 110.66
Daily Pivot Point S2: 110.29
Daily Pivot Point S3: 110.01
Daily Pivot Point R1: 111.32
Daily Pivot Point R2: 111.61
Daily Pivot Point R3: 111.98
