- After the recent sharp sell-off, USD/JPY is stabilizing near 109.70 on Friday.
- Do the bears have what it takes to continue the bear trend or will bulls take the lead and bring the market above 110.00 figure?
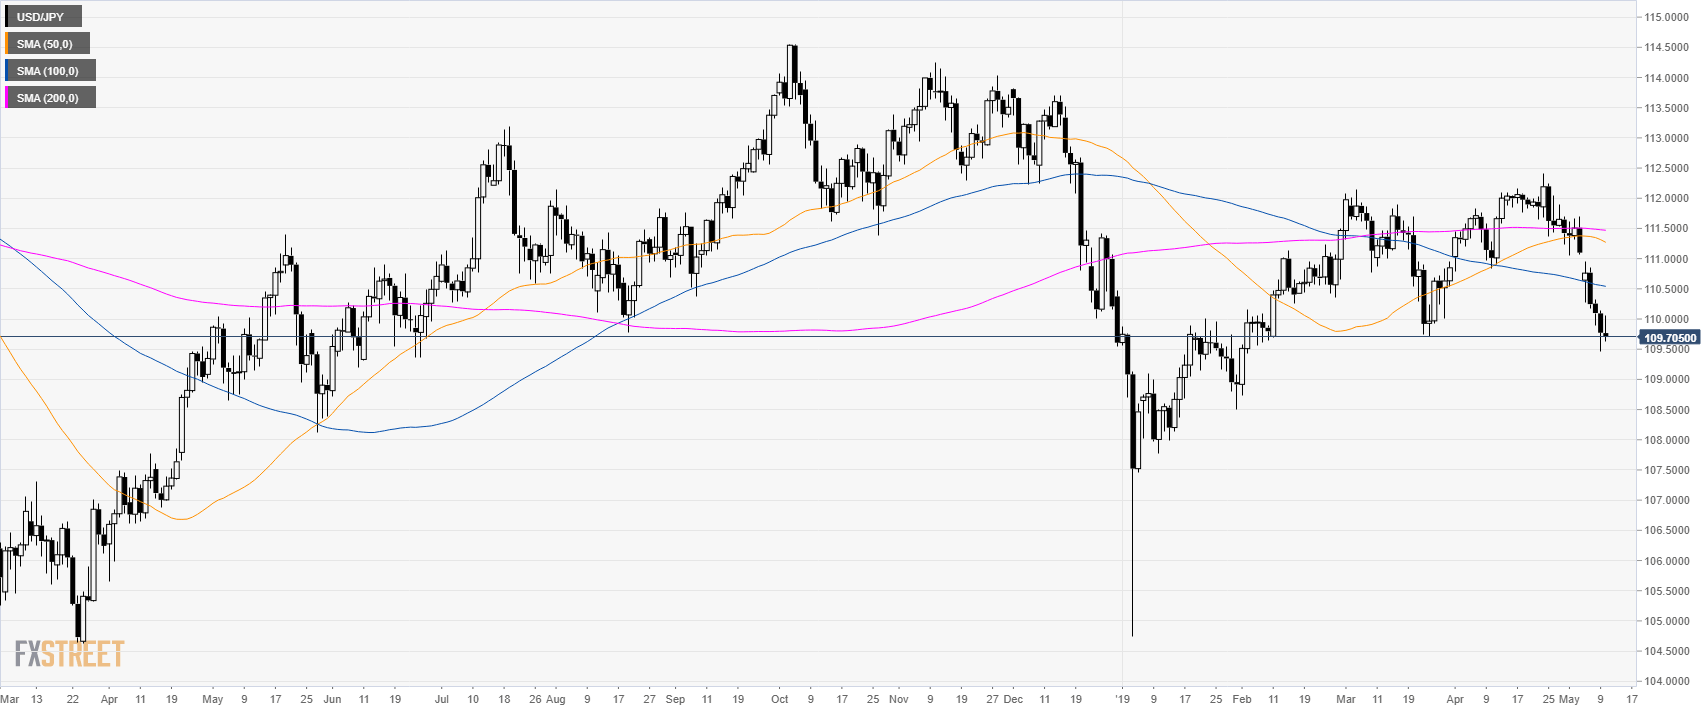
USD/JPY daily chart
USD/JPY is trading in a bear leg below its main simple moving averages (SMAs).
USD/JPY is trading at its lowest since February.
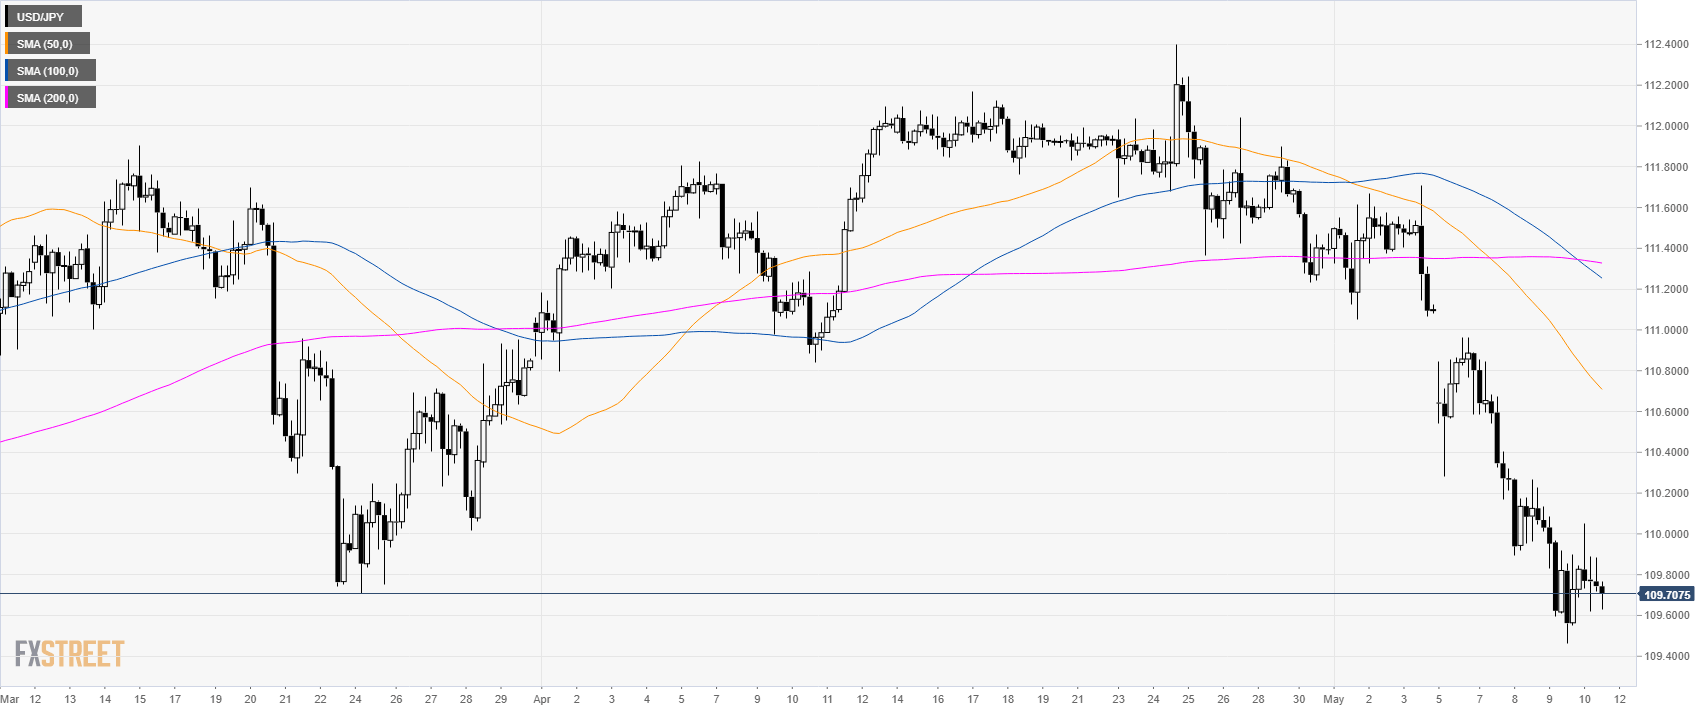
USD/JPY 4-hour chart
USD/JPY is trading steeply down below the 110.00 figure and the main SMAs suggesting a bearish bias in the medium-term.
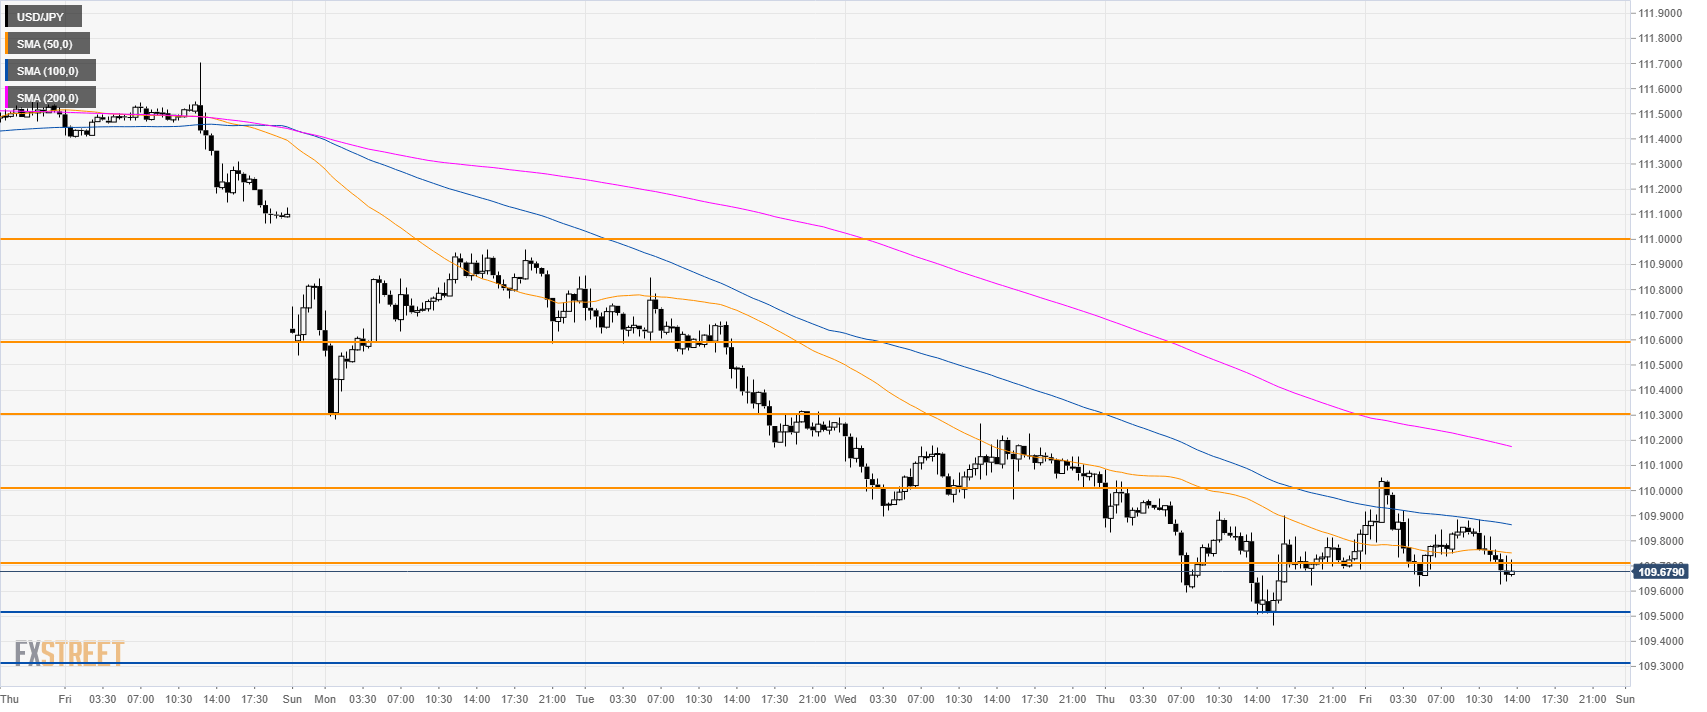
USD/JPY 30-minute chart
USD/JPY is trading down below its main SMAs suggesting bearish momentum in the short-term.
Bulls are trying to stabilize the market near 109.70. However, bears will try to breach 109.50 to target 109.30 level. Resistances are seen at 110.00 and 110.30.
Additional key levels
