- The demand for Yen as a safe-haven currency has been weak in the last two days.
- The levels to beat for bulls are at the 106.12 and 106.30 resistances.
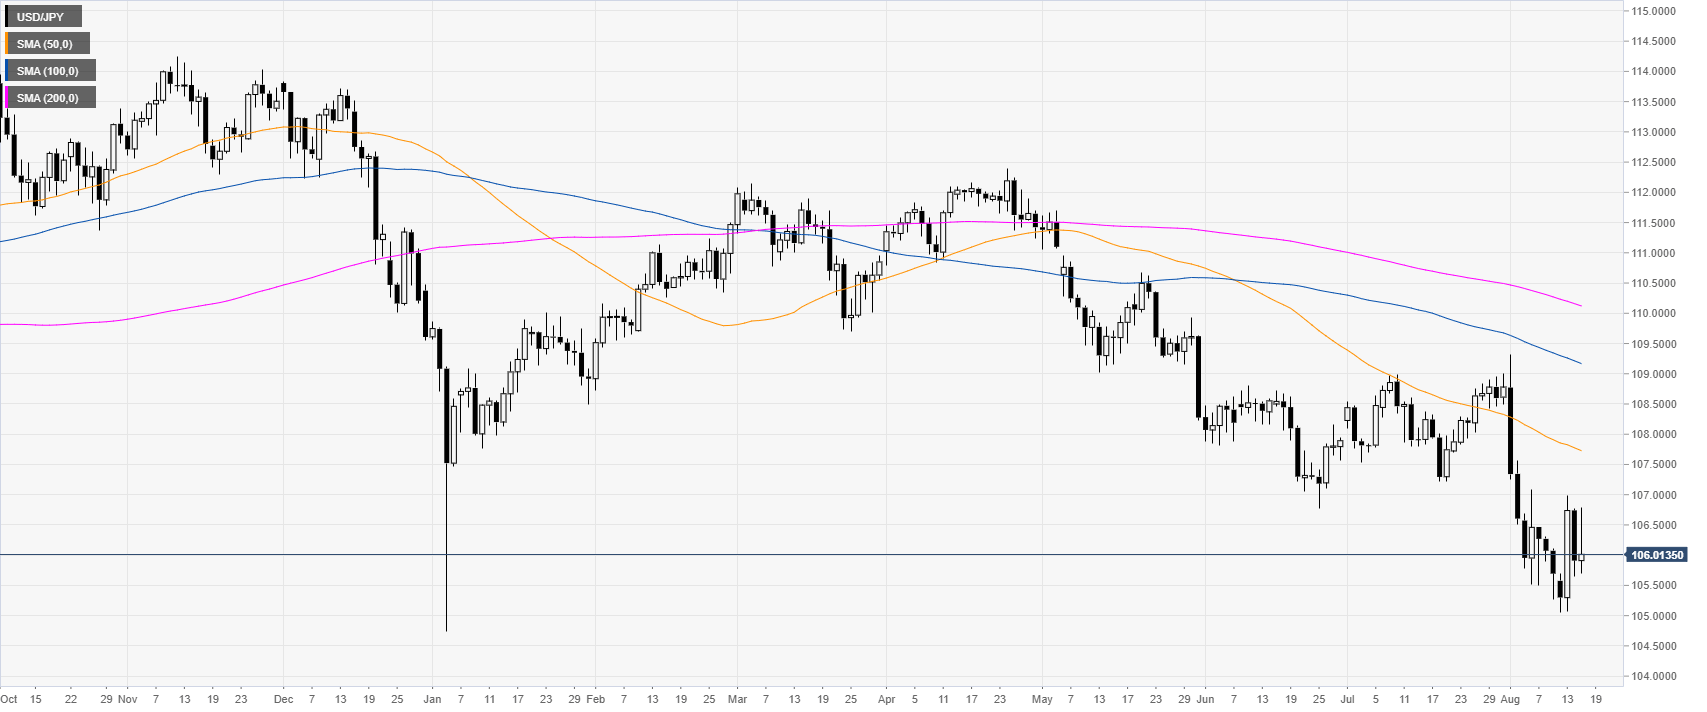
USD/JPY daily chart
USD/JPY is trading near multi-month lows while below the main daily simple moving averages (DSMAs). The market is trading just above the 106.00 handle. Trade war news is the primary driver of the USD/JPY currency pair.
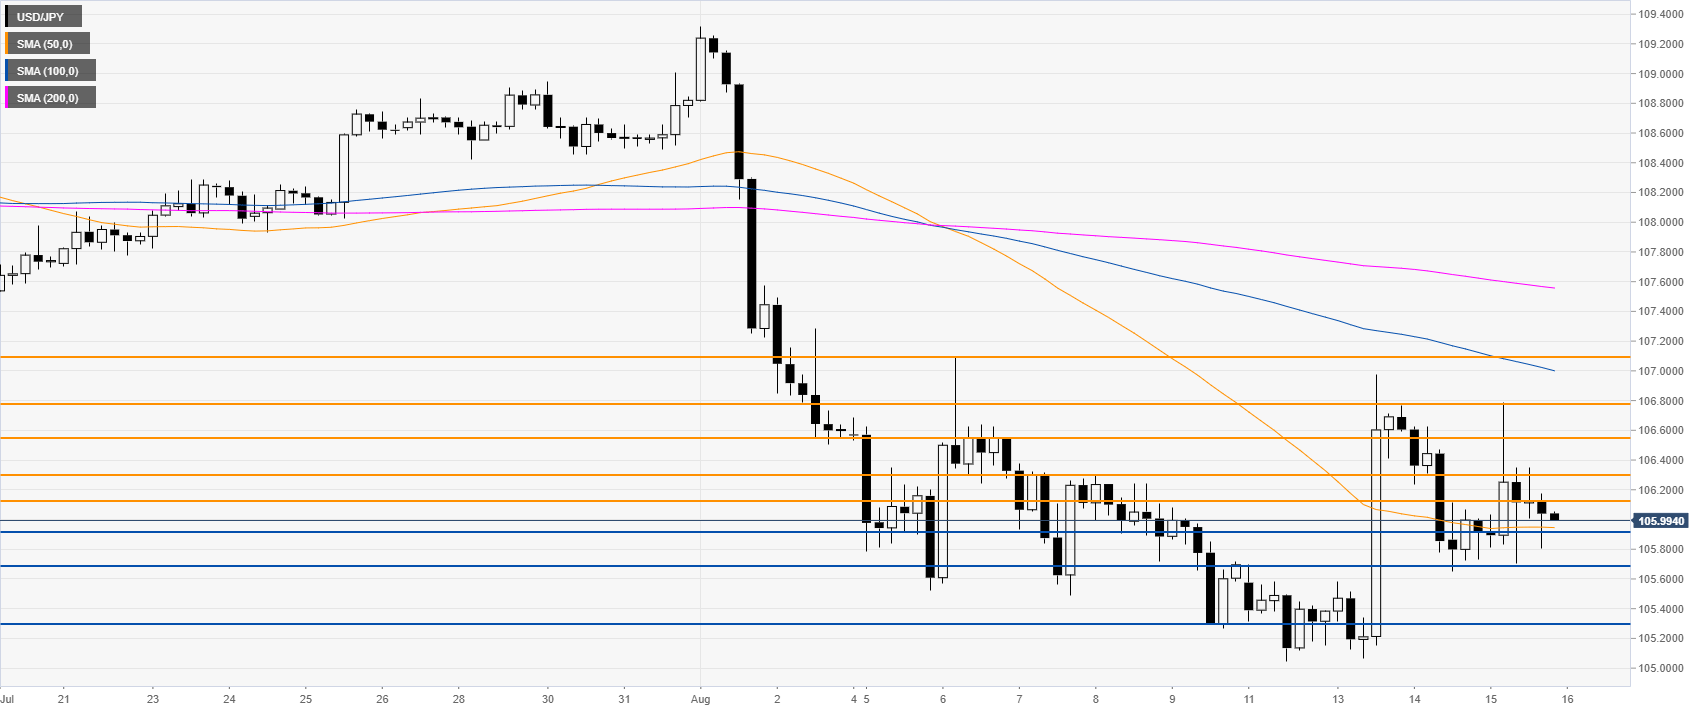
USD/JPY 4-hour chart
USD/JPY made no significant progress this Thursday as it sits just above its 50 SMA. The bears would need to break below 105.92 to reach 105.68 and 105.30, according to the Technical Confluences Indicator.
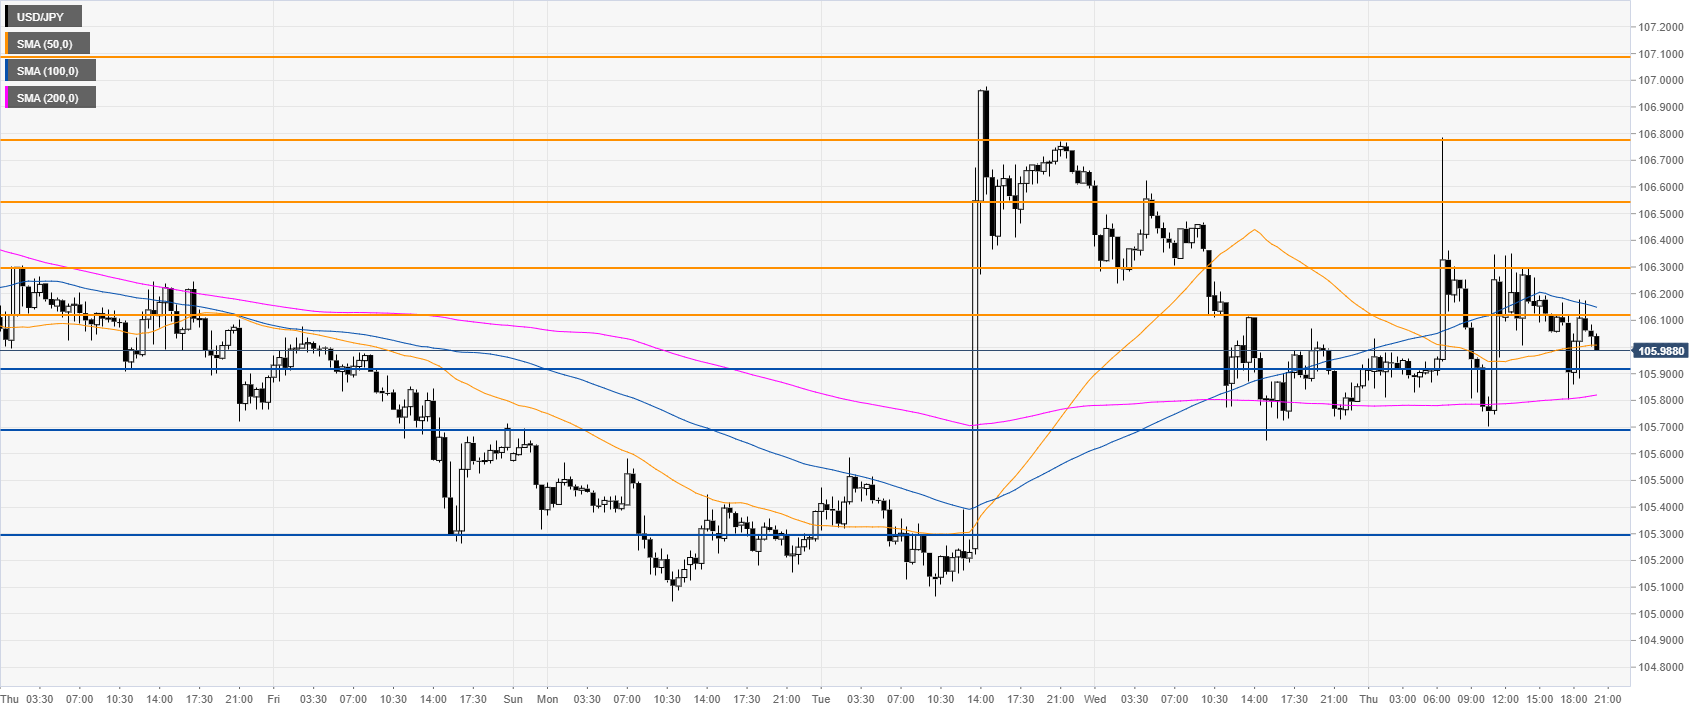
USD/JPY 30-minute chart
Dollar/Yen is trading above the 200 SMA as the market is consolidating the Tuesday bullish move. There could be upside momentum on Friday or next week. However, bulls have several layers of resistances to break at 106.12, 106.30, 106.55 and 106.77 levels, according to the Technical Confluences Indicator.
Additional key levels
