- USD/JPY is trading at daily highs at the start of the New York session.
- The level to beat for bulls is the 108.73 resistance.
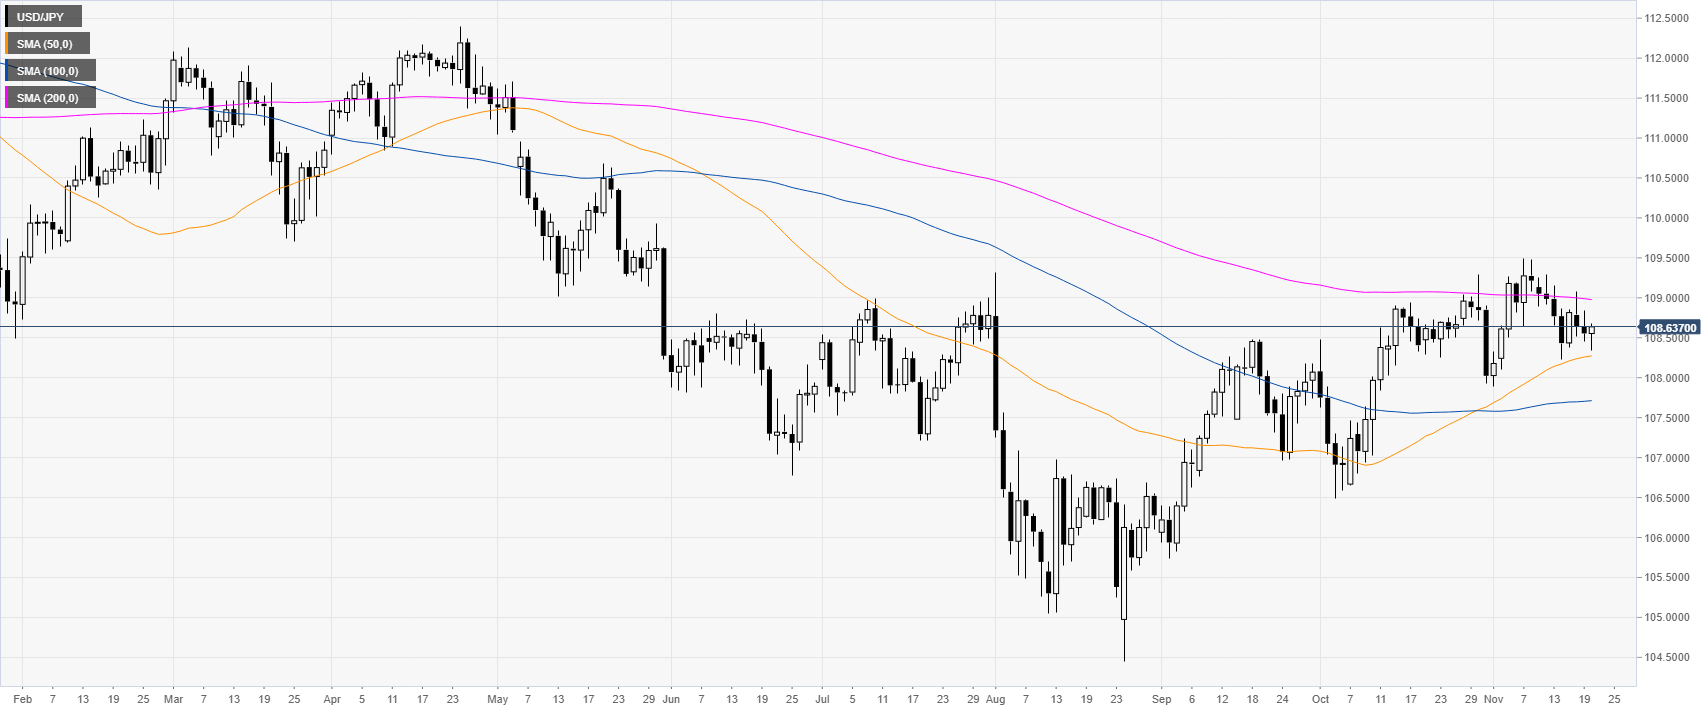
USD/JPY daily chart
USD/JPY is evolving above the 108.00 handle and the 50-day simple moving average (DMA) on the daily chart. In the last 2.5 months, the market has been gaining ground.
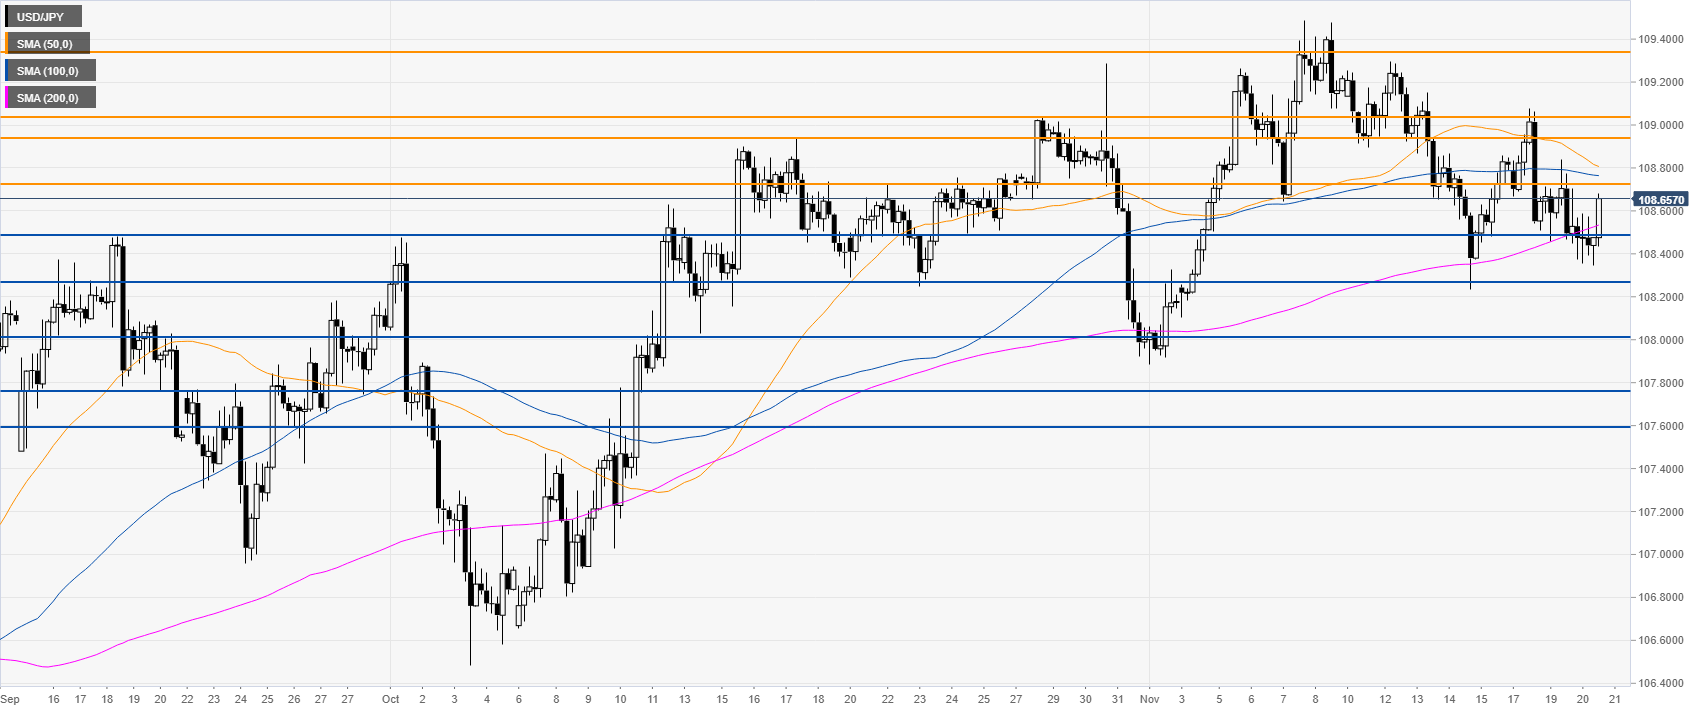
USD/JPY four-hour chart
USD/JPY is trading above the 108.50 support level and the 200 SMA. A break above 108.73 can lead to a potential run towards the 108.94/109.05 resistance zone near, according to the Technical Confluences Indicator.
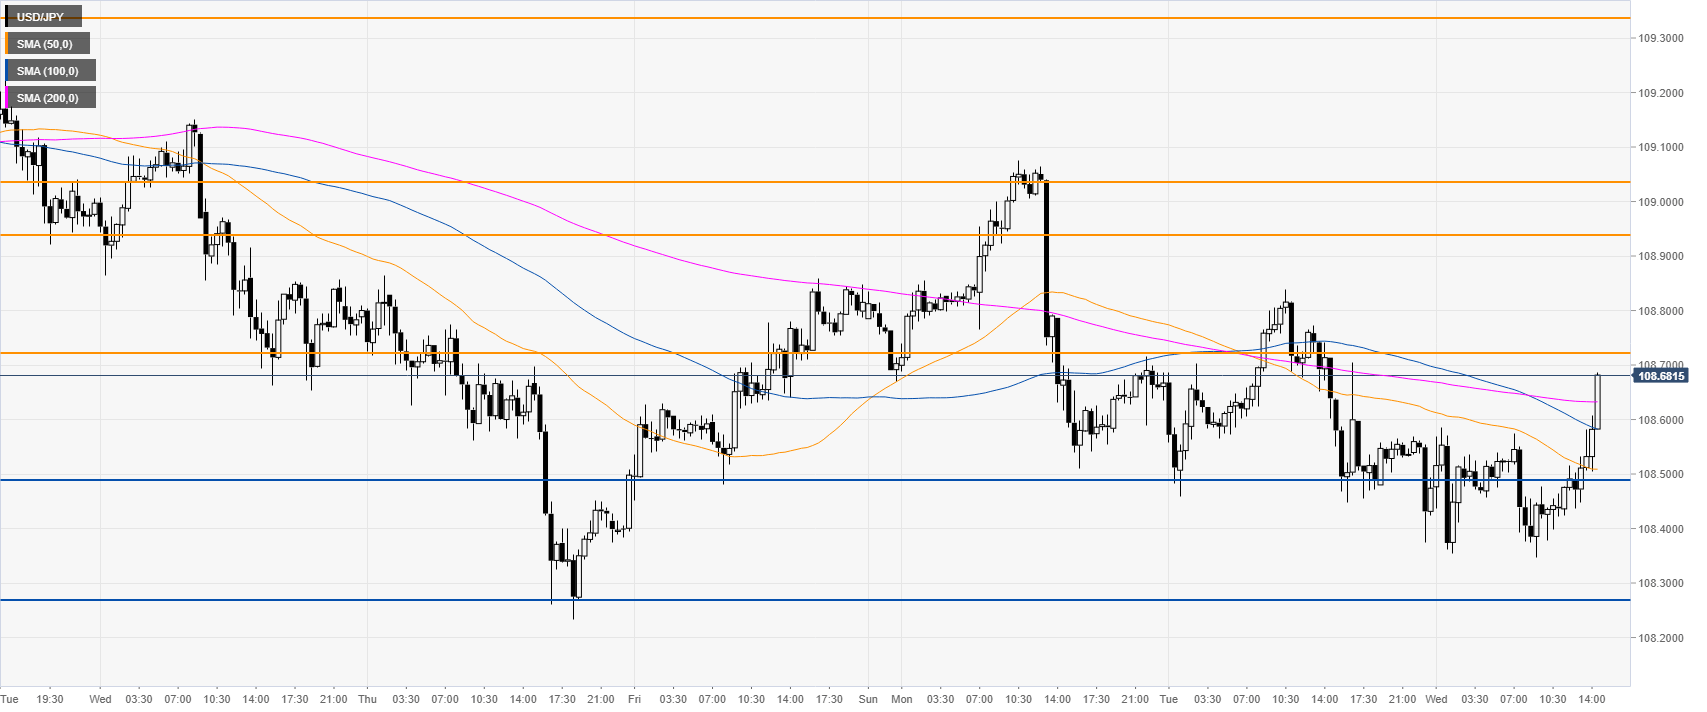
USD/JPY 30-minute chart
USD/JPY is trading above its main SMAs on the 30-minute chart suggesting a bullish bias in the near term. Support is seen at the 108.50 and 108.27 levels, according to the Technical Confluences Indicator.
Additional key levels
