- USD/JPY is trading at daily lows after the London close this Friday.
- The level to beat for bears is the 108.49 level.
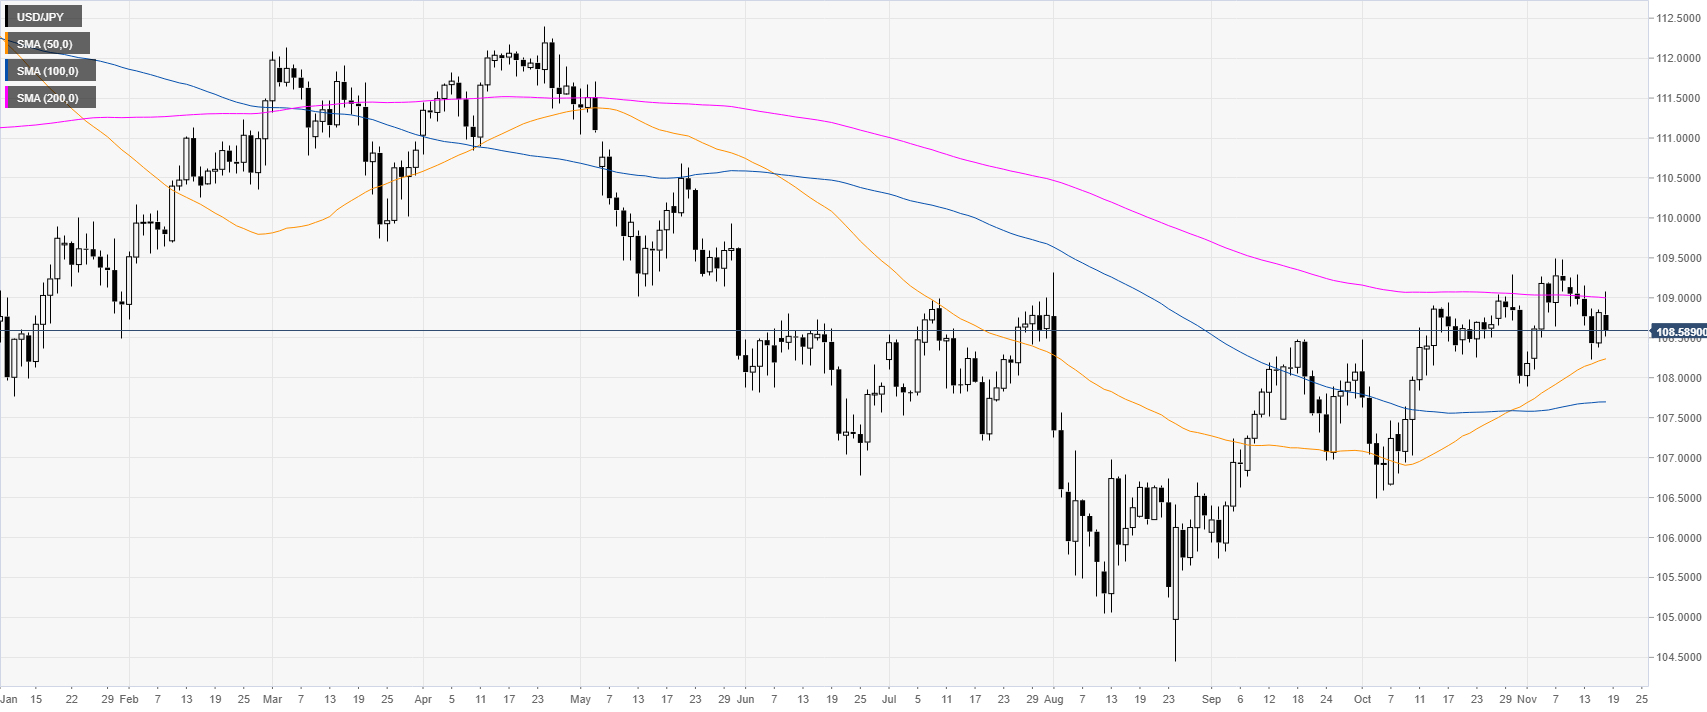
USD/JPY daily chart
USD/JPY is ranging just below the 109.00 handle and the 200-day simple moving average (DMA) on the daily time frame. In both September and November, the market has been accelerating to the upside.
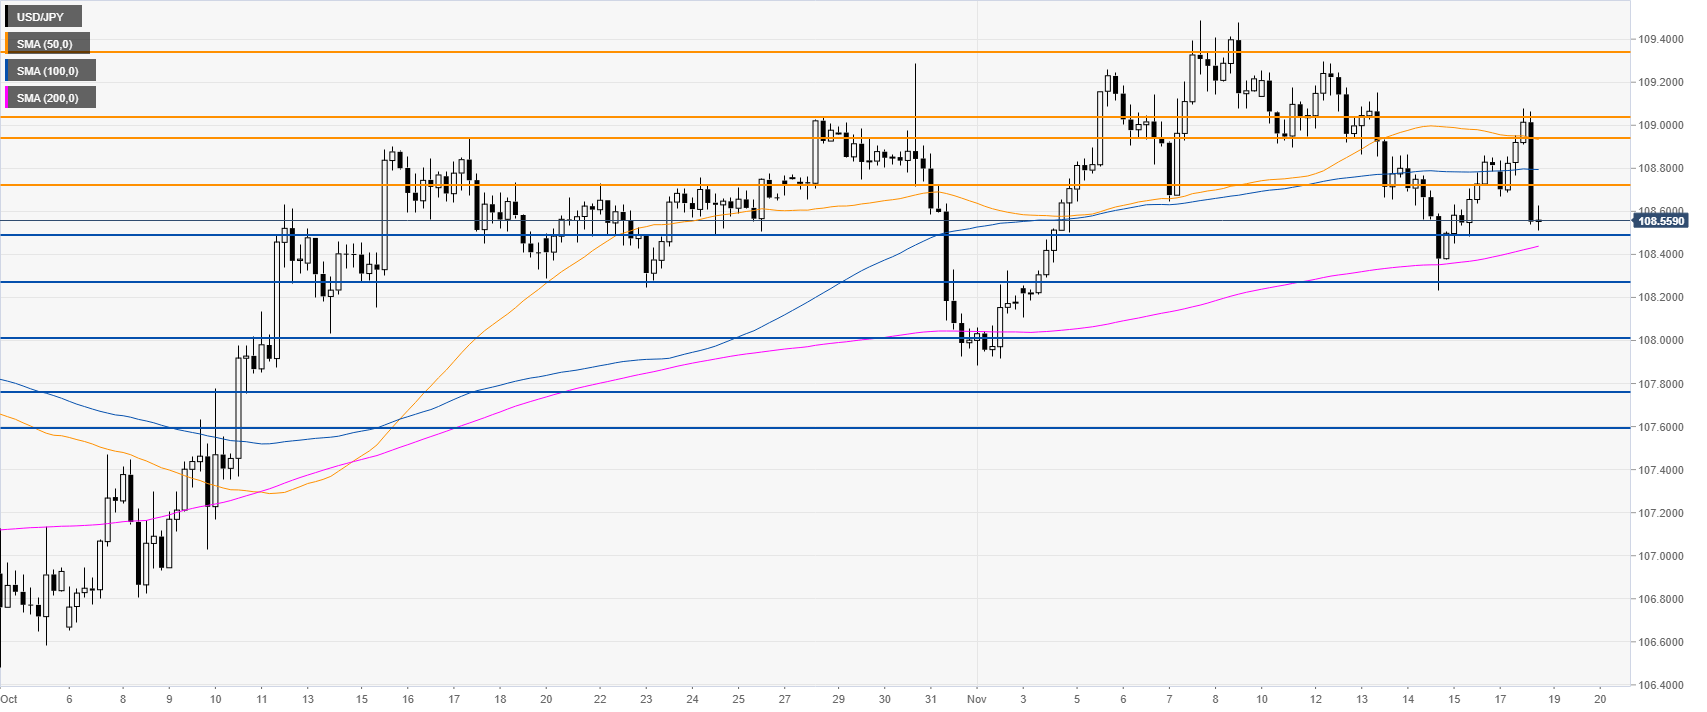
USD/JPY four-hour chart
USD/JPY dropped this Monday rejecting the 109.00 handle as well as the 50 and 100 SMAs. If the bears overcome the 108.49 support and the 200 SMA, the market might continue to decline towards the November lows and the 108.27, 108.00, 107.75 and 107.59 support levels.
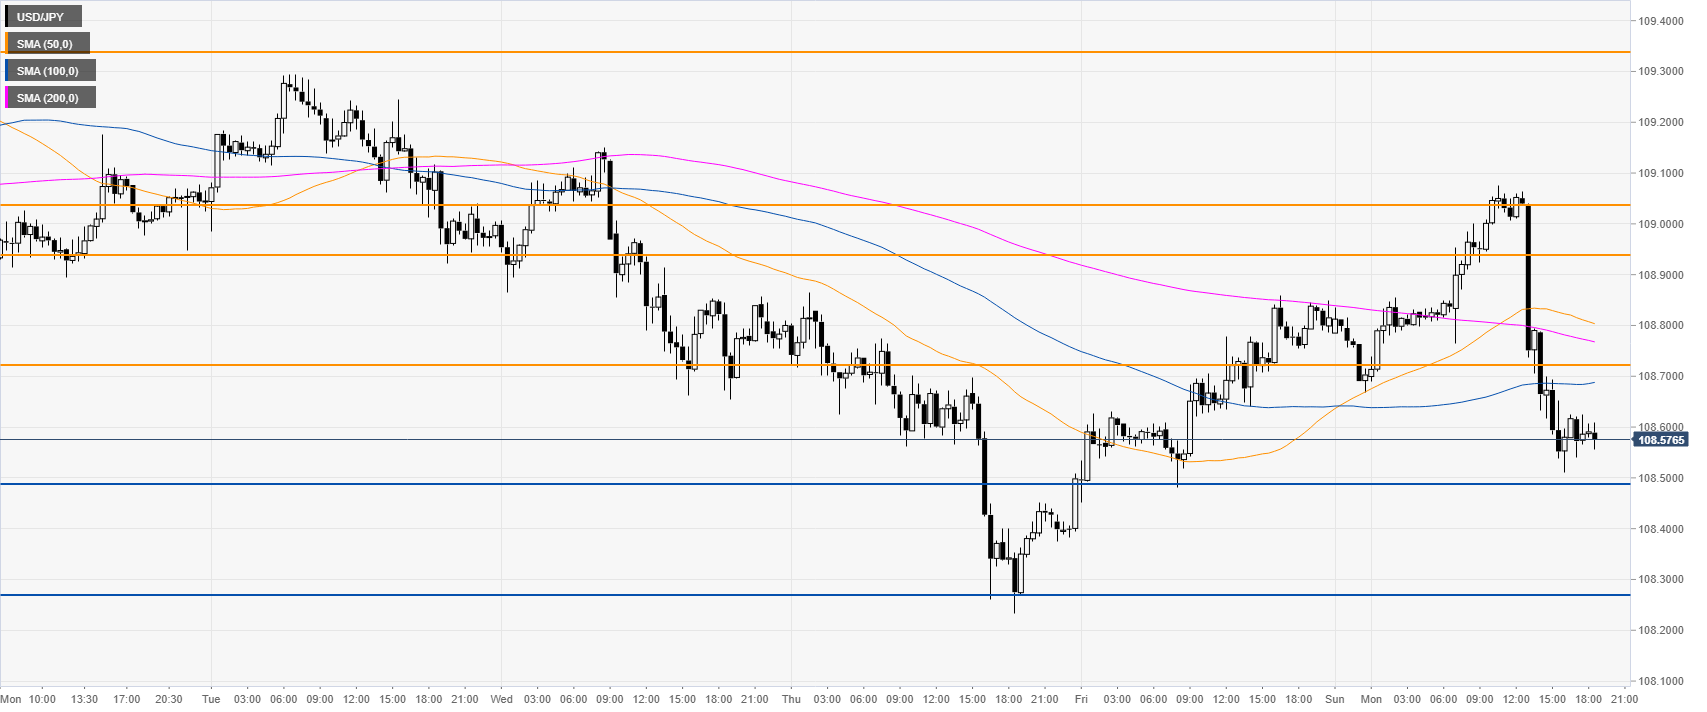
USD/JPY 30-minute chart
USD/JPY is trading below the main SMAs on the 30-minute chart. Resistance can be found near 108.75, 108.94, 109.05 and 109.35 levels according to the Technical Confluences Indicator.
Additional key levels
