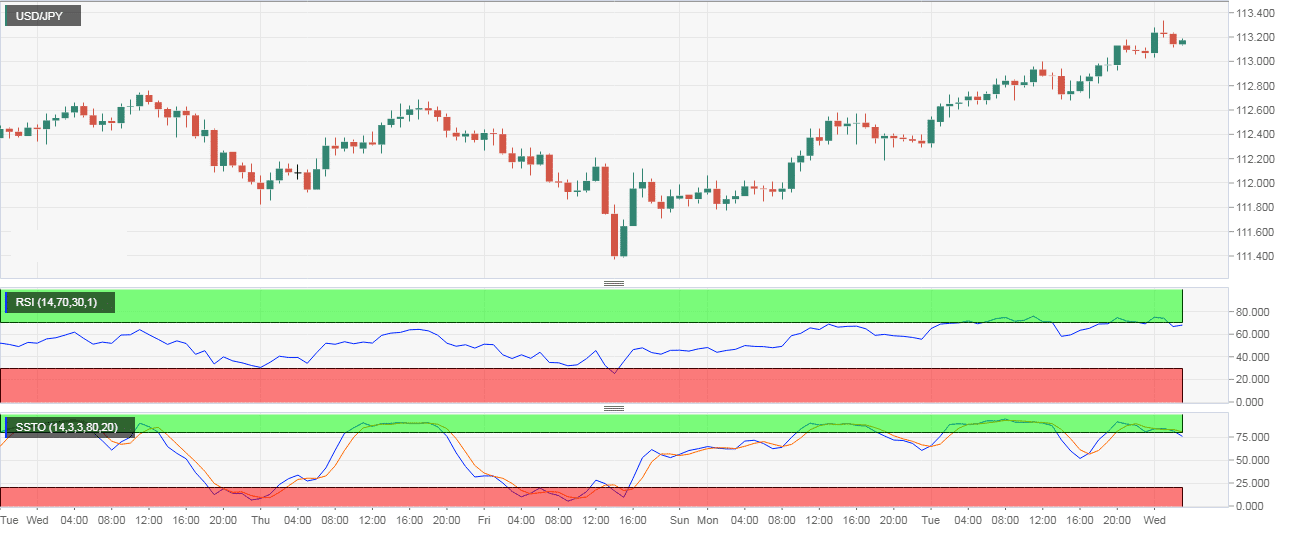
Currently, the USD/JPY is trading at 113.14, having clocked a three-week high of 113.33 earlier today.
Both RSI and Stochastic are reporting overbought conditions on the hourly chart. Further, the previous hourly candle was a dog, which usually indicates indecision in the marketplace, but when viewed against the backdrop of the rally from the low of 111.38, the doji indicates bullish exhaustion.
No wonder, the pair has pulled back from three-week highs and could revisit 112.89 – former resistance-turned-support – before building on the yesterday’s bullish breakout (close above 112.89).
Hourly Chart
Trend: Pullback likely
USD/JPY
Overview:
Last Price: 113.14
Daily change: 1.0 pips
Daily change: 0.00884%
Daily Open: 113.13
Trends:
Daily SMA20: 112.69
Daily SMA50: 112.23
Daily SMA100: 111.63
Daily SMA200: 109.88
Levels:
Daily High: 113.13
Daily Low: 112.3
Weekly High: 112.9
Weekly Low: 111.38
Monthly High: 113.71
Monthly Low: 110.38
Daily Fibonacci 38.2%: 112.81
Daily Fibonacci 61.8%: 112.62
Daily Pivot Point S1: 112.57
Daily Pivot Point S2: 112.01
Daily Pivot Point S3: 111.73
Daily Pivot Point R1: 113.41
Daily Pivot Point R2: 113.69
Daily Pivot Point R3: 114.25
