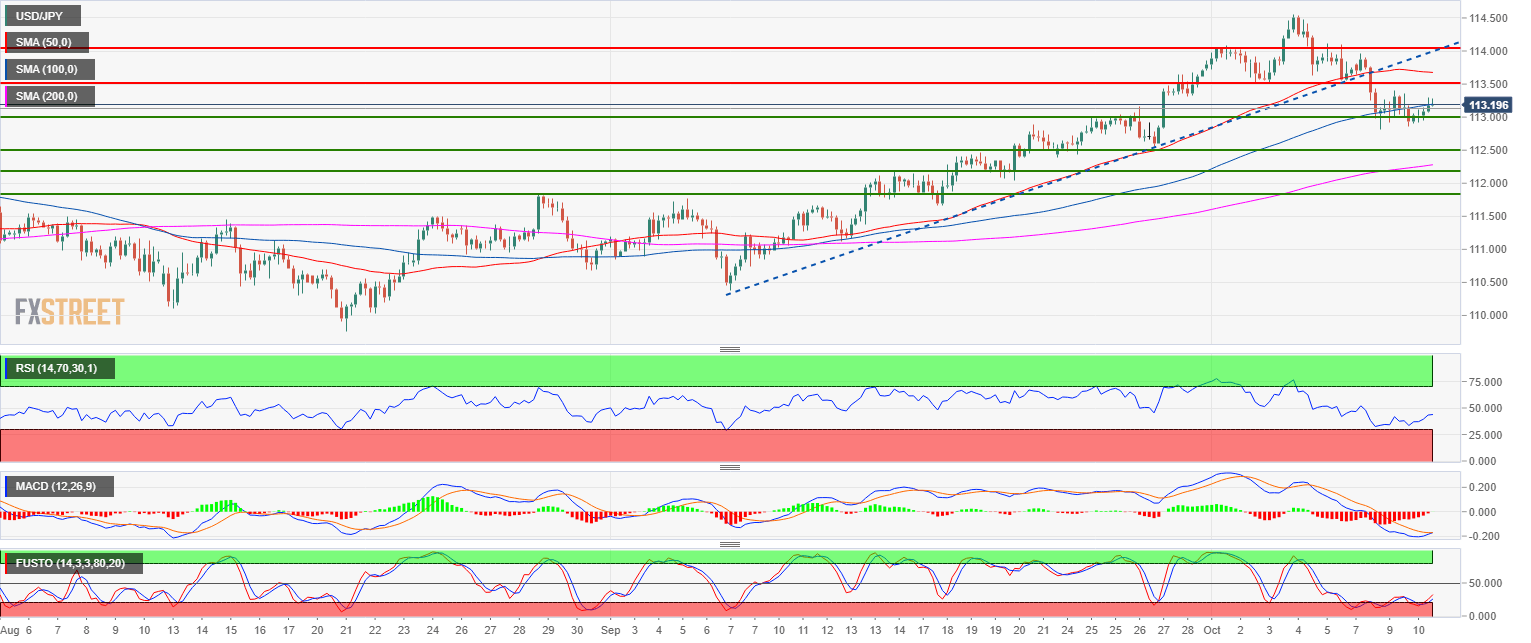
- USD/JPY is in pullback mode while it is trading in a bull trend.
- The bears broke below the trendline (blue) and the 50-period simple moving average. USD/JPY is currently consolidating the recent decline below 113.55 (October 2 low) near the 100-period simple moving average.
- Failure to break above 113.55 should lead to more decline in the short term. Targets to the downside can be located near 113.00 figure and 112.55 (September 27 low). A breakout above 113.55 would invalidate the bearish bias.
Spot rate: 113.20
Relative change: 0.22%
High: 113.28
Low: 112.92
Main trend: Bullish
Short-term trend: Bearish
Resistance 1: 113.55 October 2 low
Resistance 2: 114.00 figure
Resistance 3: 114.80 November 2017 high
Resistance 4: 115.50 March 10, 2017 high
Support 1: 113.00 figure
Support 2: 112.55 September 27 low
Support 3: 112.00-112.17 zone, figure and August 1 swing high
Support 4: 111.84 August 29 swing high
