- USD/JPY bull trend is on hold as the market is having a strong pullback down.
- USD/JPY is trading below its 200-period simple moving average (SMA) while the MACD indicator is remaining in negative territories. The bearish bias is kept as long as USD/JPY is capped by 112.55 resistance and 200 SMA
- Targets to the downside are seen near 111.84 August 29 swing high and 111.00 figure.
USD/JPY 4-hour chart
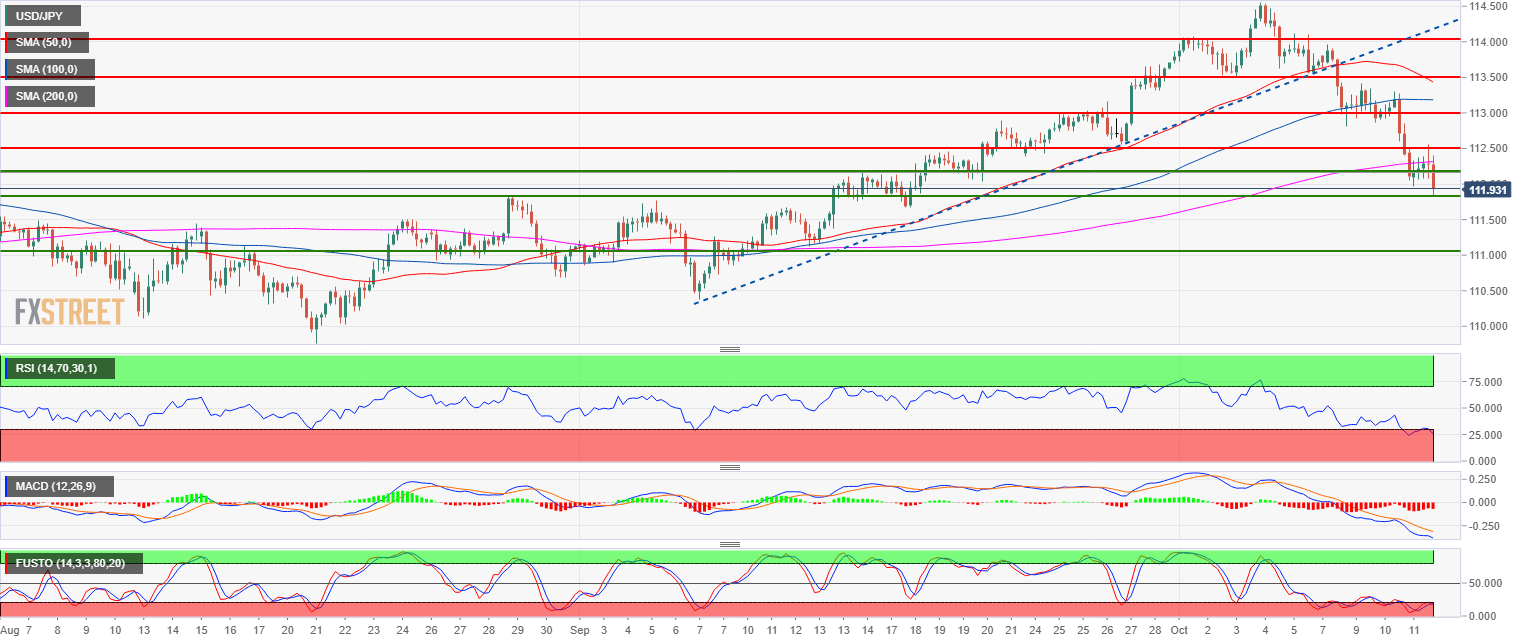
Spot rate: 112.00
Relative change: -0.23%
High: 112.53
Low: 111.83
Main trend: Bullish
Short-term trend: Bearish
Resistance 1: 112.55 September 27 low
Resistance 2: 113.00 figure
Resistance 3: 113.55 October 2 low
Resistance 4: 113.55 October 2 low
Resistance 5: 114.00 figure
Resistance 6: 114.80 November 2017 high
Resistance 7: 115.50 March 10, 2017 high
Support 1: 112.00-112.17 zone, figure and August 1 swing high
Support 2: 111.84 August 29 swing high
Support 3: 111.00 figure
