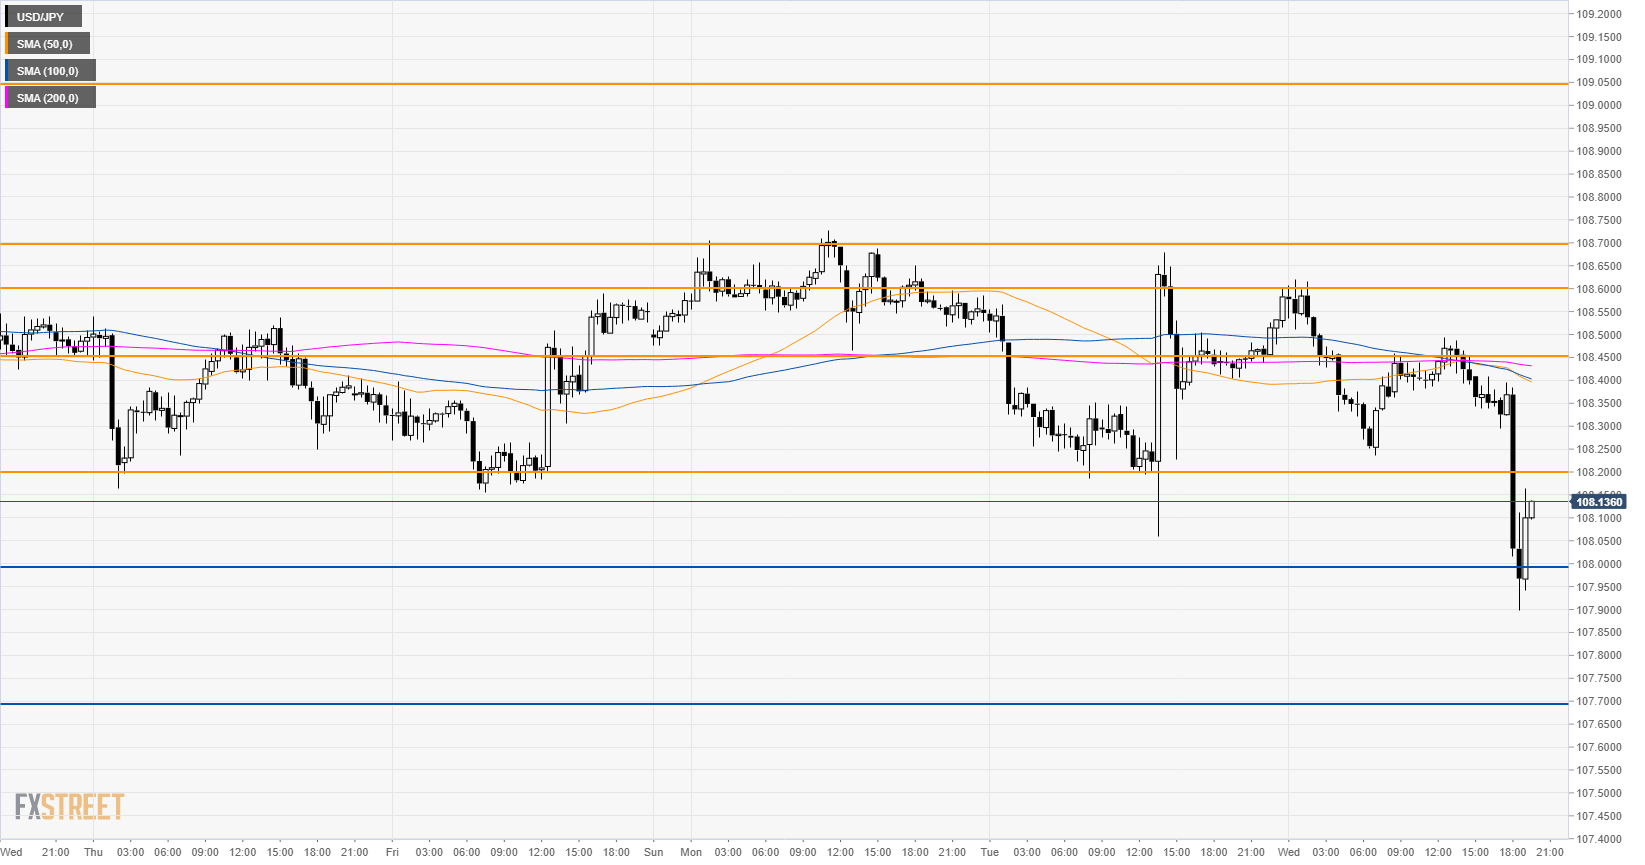
- USD/JPY remains trapped in its range between 108.00 support and 108.70 resistance
- The level to beat for bulls is 108.20 according to the Technical Confluences Indicator.
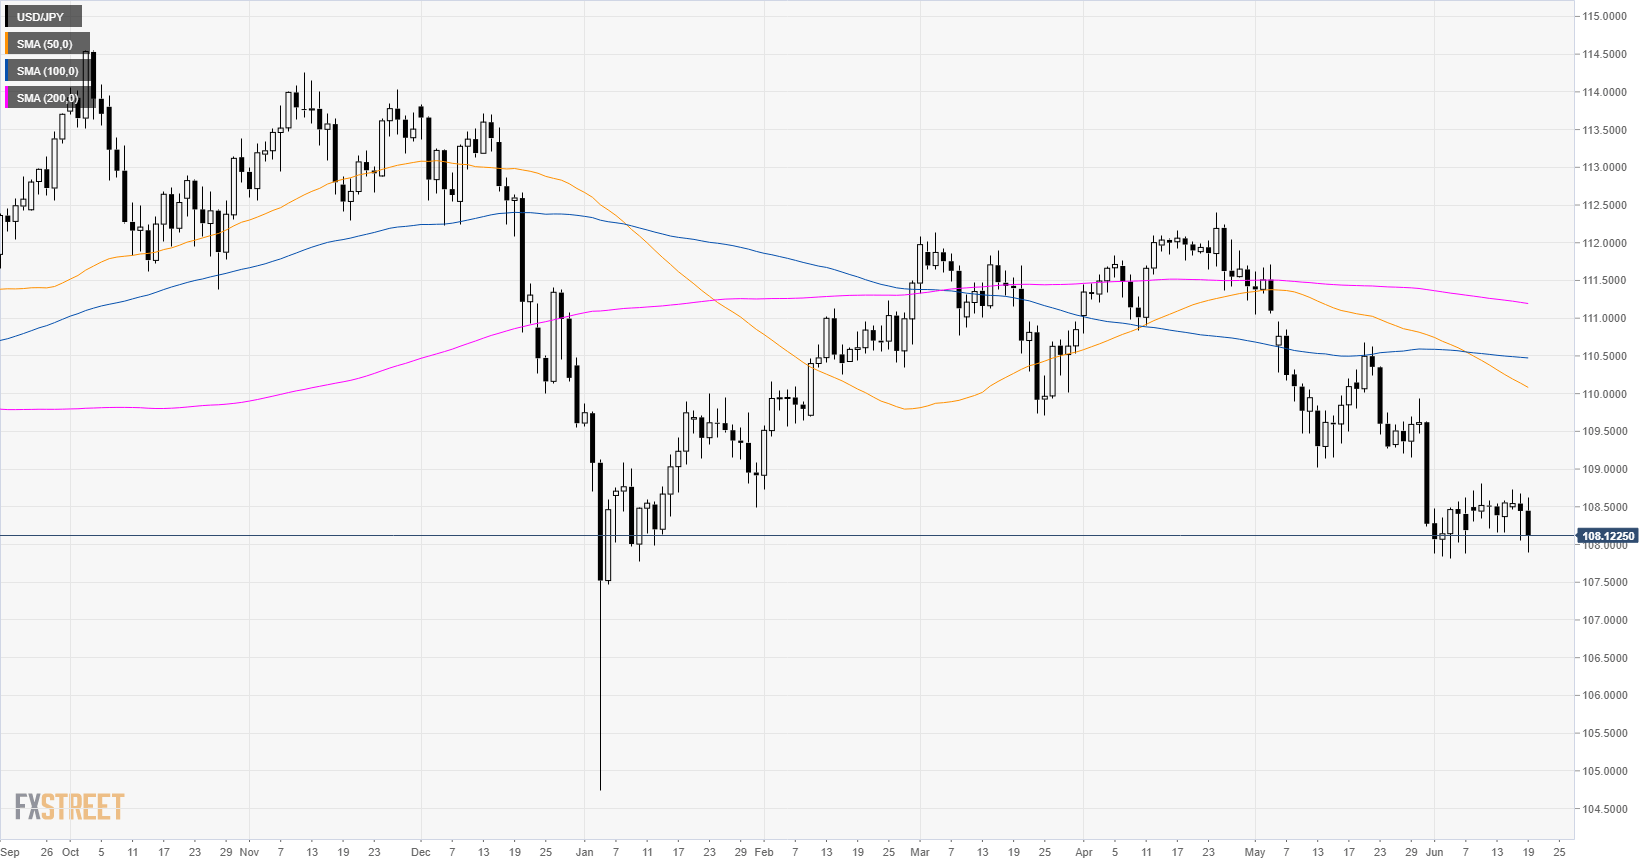
USD/JPY daily chart
USD/JPY is in a bear trend below its main daily simple moving averages (DSMAs). The 50 DSMA crossed below the 100 DSMA which is seen as bearish. USD/JPY remains trapped in its consolidation despite the Fed dovish message.

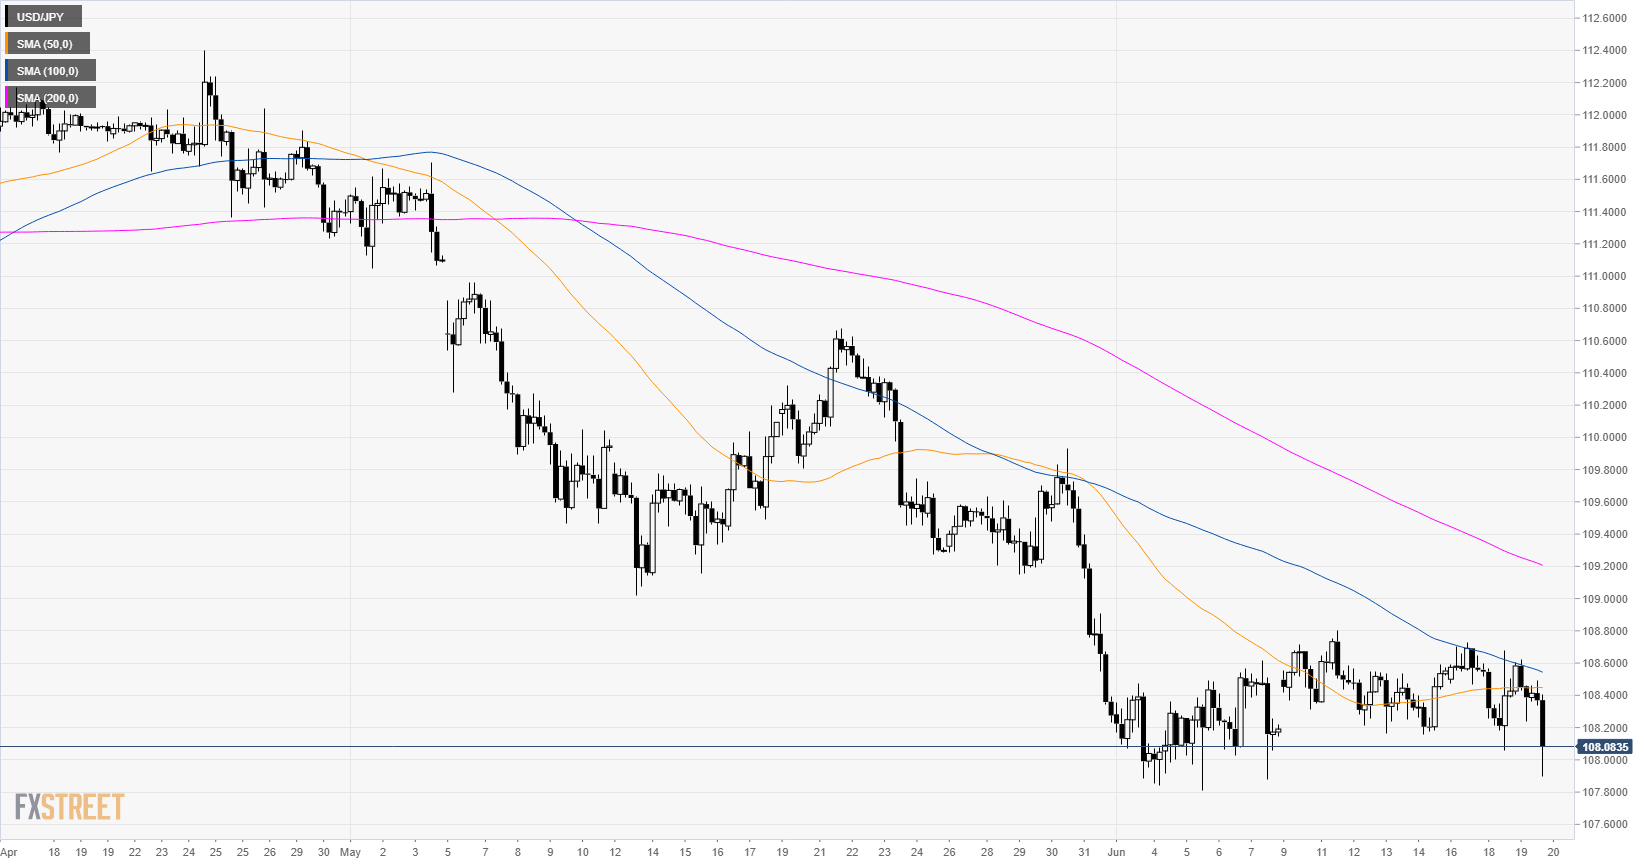
USD/JPY 4-hour chart
USD/JPY is under bearish pressure below its main SMAs.
USD/JPY 30-minute chart
The market dipped briefly below 108.00 figure but the support held and USD/JPY remains in range. According to the Technical Confluences Indicator, there is moderate resistance at 108.20 (last week low and the lower Bollinger Band on the 1-hour chart) followed by 108.45 (simple moving averages cluster). Further lies 108.70 resistance (Fibonacci cluster). A break above this level can potentially lead to 108.84 (near the previous week high and the weekly pivot point resistance 1). Support is at 108.00 and 107.70.
Additional key levels
